Trajectory of human migration: Insights from autosomal and non-autosomal variant clustering patterns
Abstract
Genetic variations present in the Y chromosomal and mitochondrial DNA provide the molecular basis to support the archeological and anthropological evidence that formulates the theories for describing the trajectory of human migration, which started almost 200,000 years ago out of Africa. These genetic variations have long been used as ancestry informative markers (AIMs) in forensics and evolutionary studies, primarily because of their uniparental inheritance and lack of recombination, despite the fact that gender specific gene flow and socio-cultural practices may cause discrepancies. Moreover, the genetic markers on the Y- chromosome constitute only a minor fraction of the entire human genome. Here, we analyzed over 75 million genetic variants (single nucleotide variants (SNVs) and short insertion-deletion (InDels)) within consecutive 2500000 base pair windows in the autosomal as well as non-autosomal chromosomes of 22 populations in four major geographic regions that are cataloged in the 1000 Genomes Project to understand the clustering patterns of the autosomal and non-autosomal variants. While autosomal and X-chromosomal variants cluster the populations of similar geographic regions together, Y-chromosomal variants constantly place the East Asian Japanese, and the European Finnish populations in a single clade in hierarchical clusters. In conclusion, this comprehensive genome-wide analysis essentially introduces new insights into mapping the path of human migration based on the Y-chromosomal and other chromosomal variants.
INTRODUCTION
One of the most widely accepted human migration theories, ‘Out of Africa Theory’ proposes that the first anatomically modern humans arose in Africa more than 200,000 years ago [1]. It also suggests that the other populations around the globe are descendants of the Africans [2]. The distribution of the Y chromosomal haplogroup by geographical area supports the 'Out of Africa' theory [3]. From Africa, modern humans headed toward Asia and other distant regions [4]. Despite the widespread acceptance of the idea that modern humans left Africa and dispersed worldwide, the next route they took remains a subject of debate. Two proposed theories potentially support the migration of modern humans out of Africa: the northern route of dispersal and the southern route of dispersal. The northern dispersal theory suggests that modern humans left Africa around 120,000 years ago and migrated through the Sinai Peninsula to the Levant [5]. The southern dispersal route suggests that early human migration occurred along the southern coast of Asia, extended from the Arabian Peninsula, via Persia and India, and eventually reached Southeast Asia and Oceania [6]. The theory that depicts the emergence of modern humans in Africa and the migration trajectory of modern humans was defined based on the mitochondrial DNA [7]. Detailed phylogenetic analyses of mitochondrial DNA support the southern dispersion. At the same time, investigation of the non-recombining portion of the Y chromosome (NRY) haplogroups indicates this pattern of migrations from south to north [8].
The primary reason for using Y chromosomal DNA and mitochondrial DNA in these studies is that their inheritance is rather straightforward. The Y chromosome is inherited only from the father, while mitochondria are inherited only from the mother. These do not undergo recombination events [7]. That is why genetic variants of the Y chromosome and mitochondria are used as potential tools to trace the migration trajectory [9].
Many genetic loci are geographically stratified, and these show significant differences in allele frequencies among people from different geographic regions [10]. These loci are called ancestry-informative markers (AIMs). AIMs not only help determine the geographical ancestry of a population, but they also have important applications in fields such as forensics, genetic association studies, drug response testing, admixture mapping, and reconstructing evolutionary histories. While mitochondrial DNA and Y chromosomal variants serve as excellent markers for determining the ancestry and lineage of individuals, these have limitations as they offer information for either paternal or maternal inheritance [11]. On top of that, local and cultural traditions influence these markers over time. Most human societies practice patrilocality. Therefore, Y-chromosome variants exhibit greater territorial localization compared to mitochondrial DNA variants [12]. Again, the migration of Tibeto-Burman-speaking tribes from China to Southeast Asia and then to northern India demonstrated a male-biased dispersal pattern and a paucity of genetic diversity in mitochondrial DNA as a result of agricultural expansion [13]. Therefore, the dispersal of genetic variants of mitochondrial DNA and the Y chromosome is not aligned with the same flow [8]. It might create some inconsistencies in defining the exact inheritance and migration patterns of humans. We, therefore, sought to analyze all genetic variants of the 22 autosomal and the non-autosomal chromosomes to find any deviation in the clustering pattern. By entailing all the variations in autosomal and non-autosomal chromosomes, a more comprehensive depiction of human migration is expected to be generated.
MATERIALS AND METHODS
Data source
The allele frequency calculator (AFC) tool at Ensembl genome browser [14] provides an interface to retrieve allele frequency for variants within a given genomic interval (the maximum range is 2500000 base pairs) for any of the given populations listed in the 1000 Genomes Project [15]. We used the AFC tool at Ensembl genome browser [14] to retrieve the allele frequencies of 75,160,938 genetic variants, including single nucleotide variants (SNVs) and short insertions and deletions (InDels), from 2,504 people from 22 populations in four major geographic regions around the globe: Africa (AFR), Europe (EUR), East Asia (EAS), and South Asia (SAS). Table 1 provides the chromosome-wise breakdown of variant numbers analyzed in this study. Supplementary table 1 provides the list of populations and their geographic distributions. The variants on each chromosome were downloaded with a window of consecutive 2500000 base pairs (e.g., variants in chromosome 1 were retrieved within the ranges: 1- 2500000, 2500001-5000000, ... , 247500001-248956422). This study involved neither any human nor animal, and hence, no ethical approval was required.
Table 1. Number of genetic variants of all chromosomes.
Data formatting
We applied a Python script to reformat and organize the downloaded data. The Python script is provided in supplementary table 2. An example of the data format is provided in supplementary table 3. The coordinates of centromeric regions were retrieved from the UCSC genome browser database [16]. The coordinates of centromeric regions are given in supplementary table 4.
Clustering and analysis of data
The statistical tools available at the web-based Metaboanalyst 5.0 platform [17] were used for unsupervised clustering of the variant frequency data by principal component analysis (PCA) as well as hierarchical clustering for each 2500000 base pair window. The input data format is shown in supplementary table 3. The variant frequencies were not normalized, scaled, transformed, or filtered. Hierarchical clustering was done following the Euclidian distance measure and Ward’s clustering algorithm.
RESULTS
Clustering based on the variants on autosomes and X chromosome
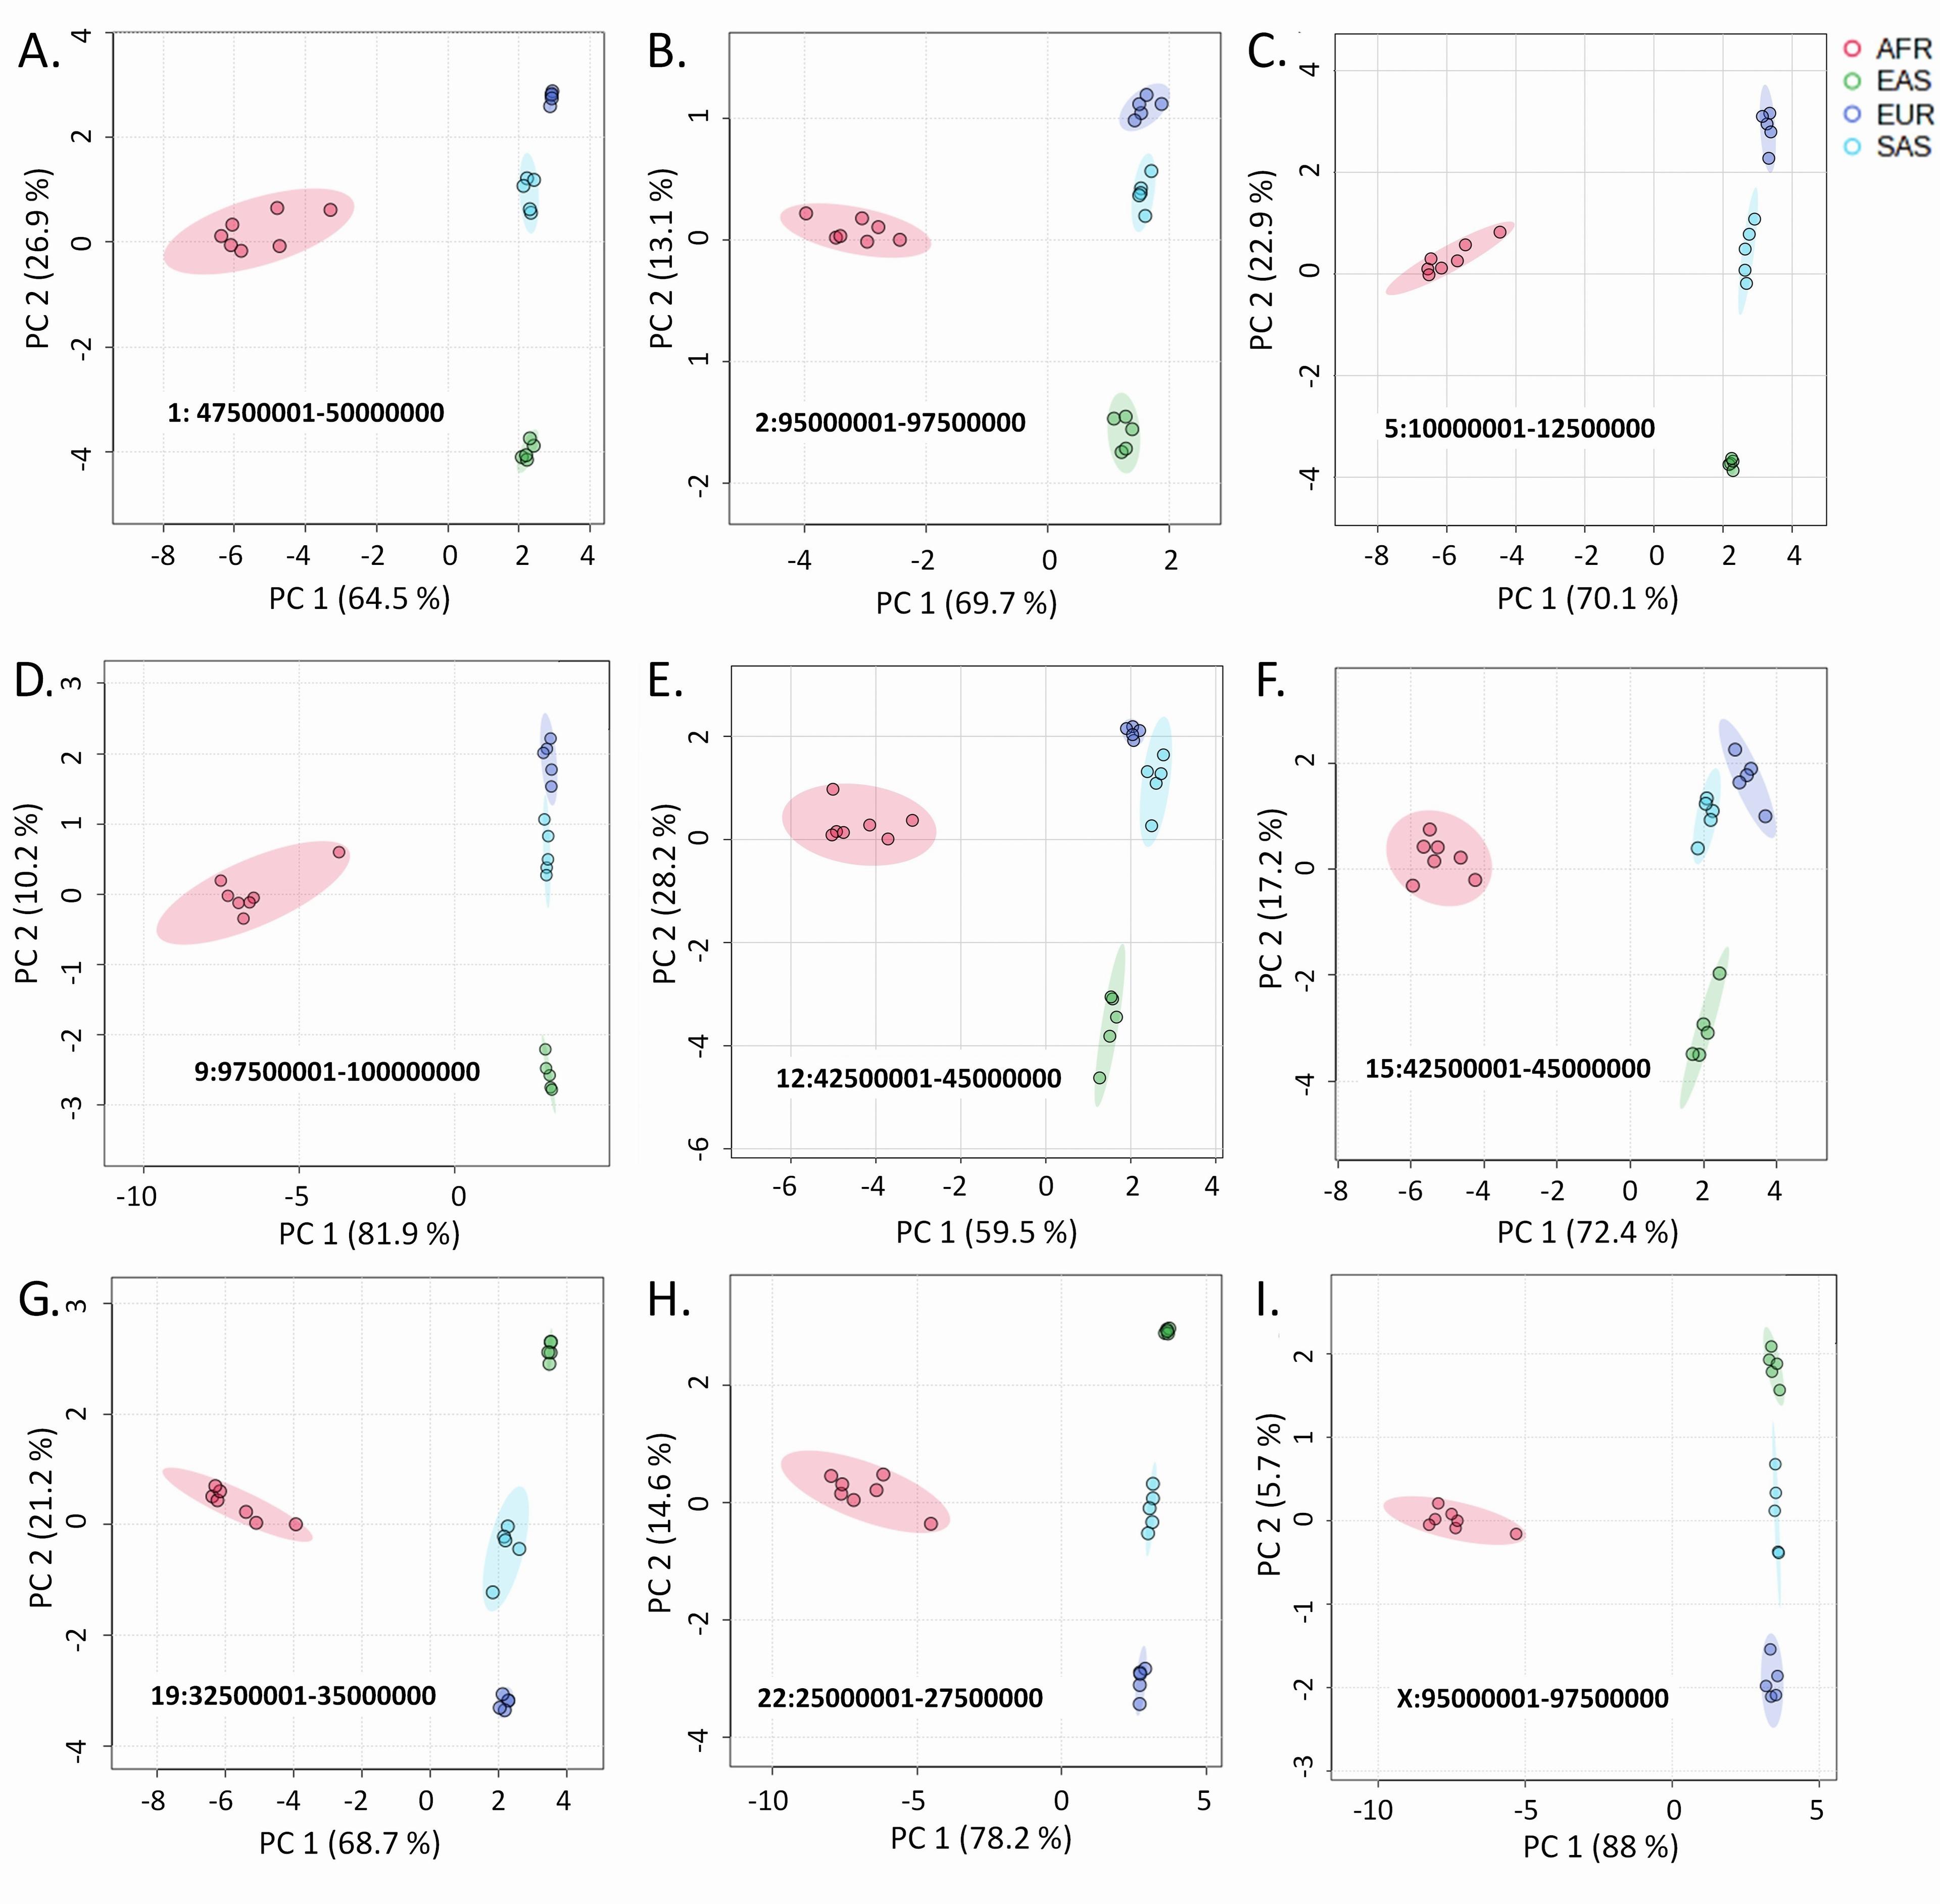
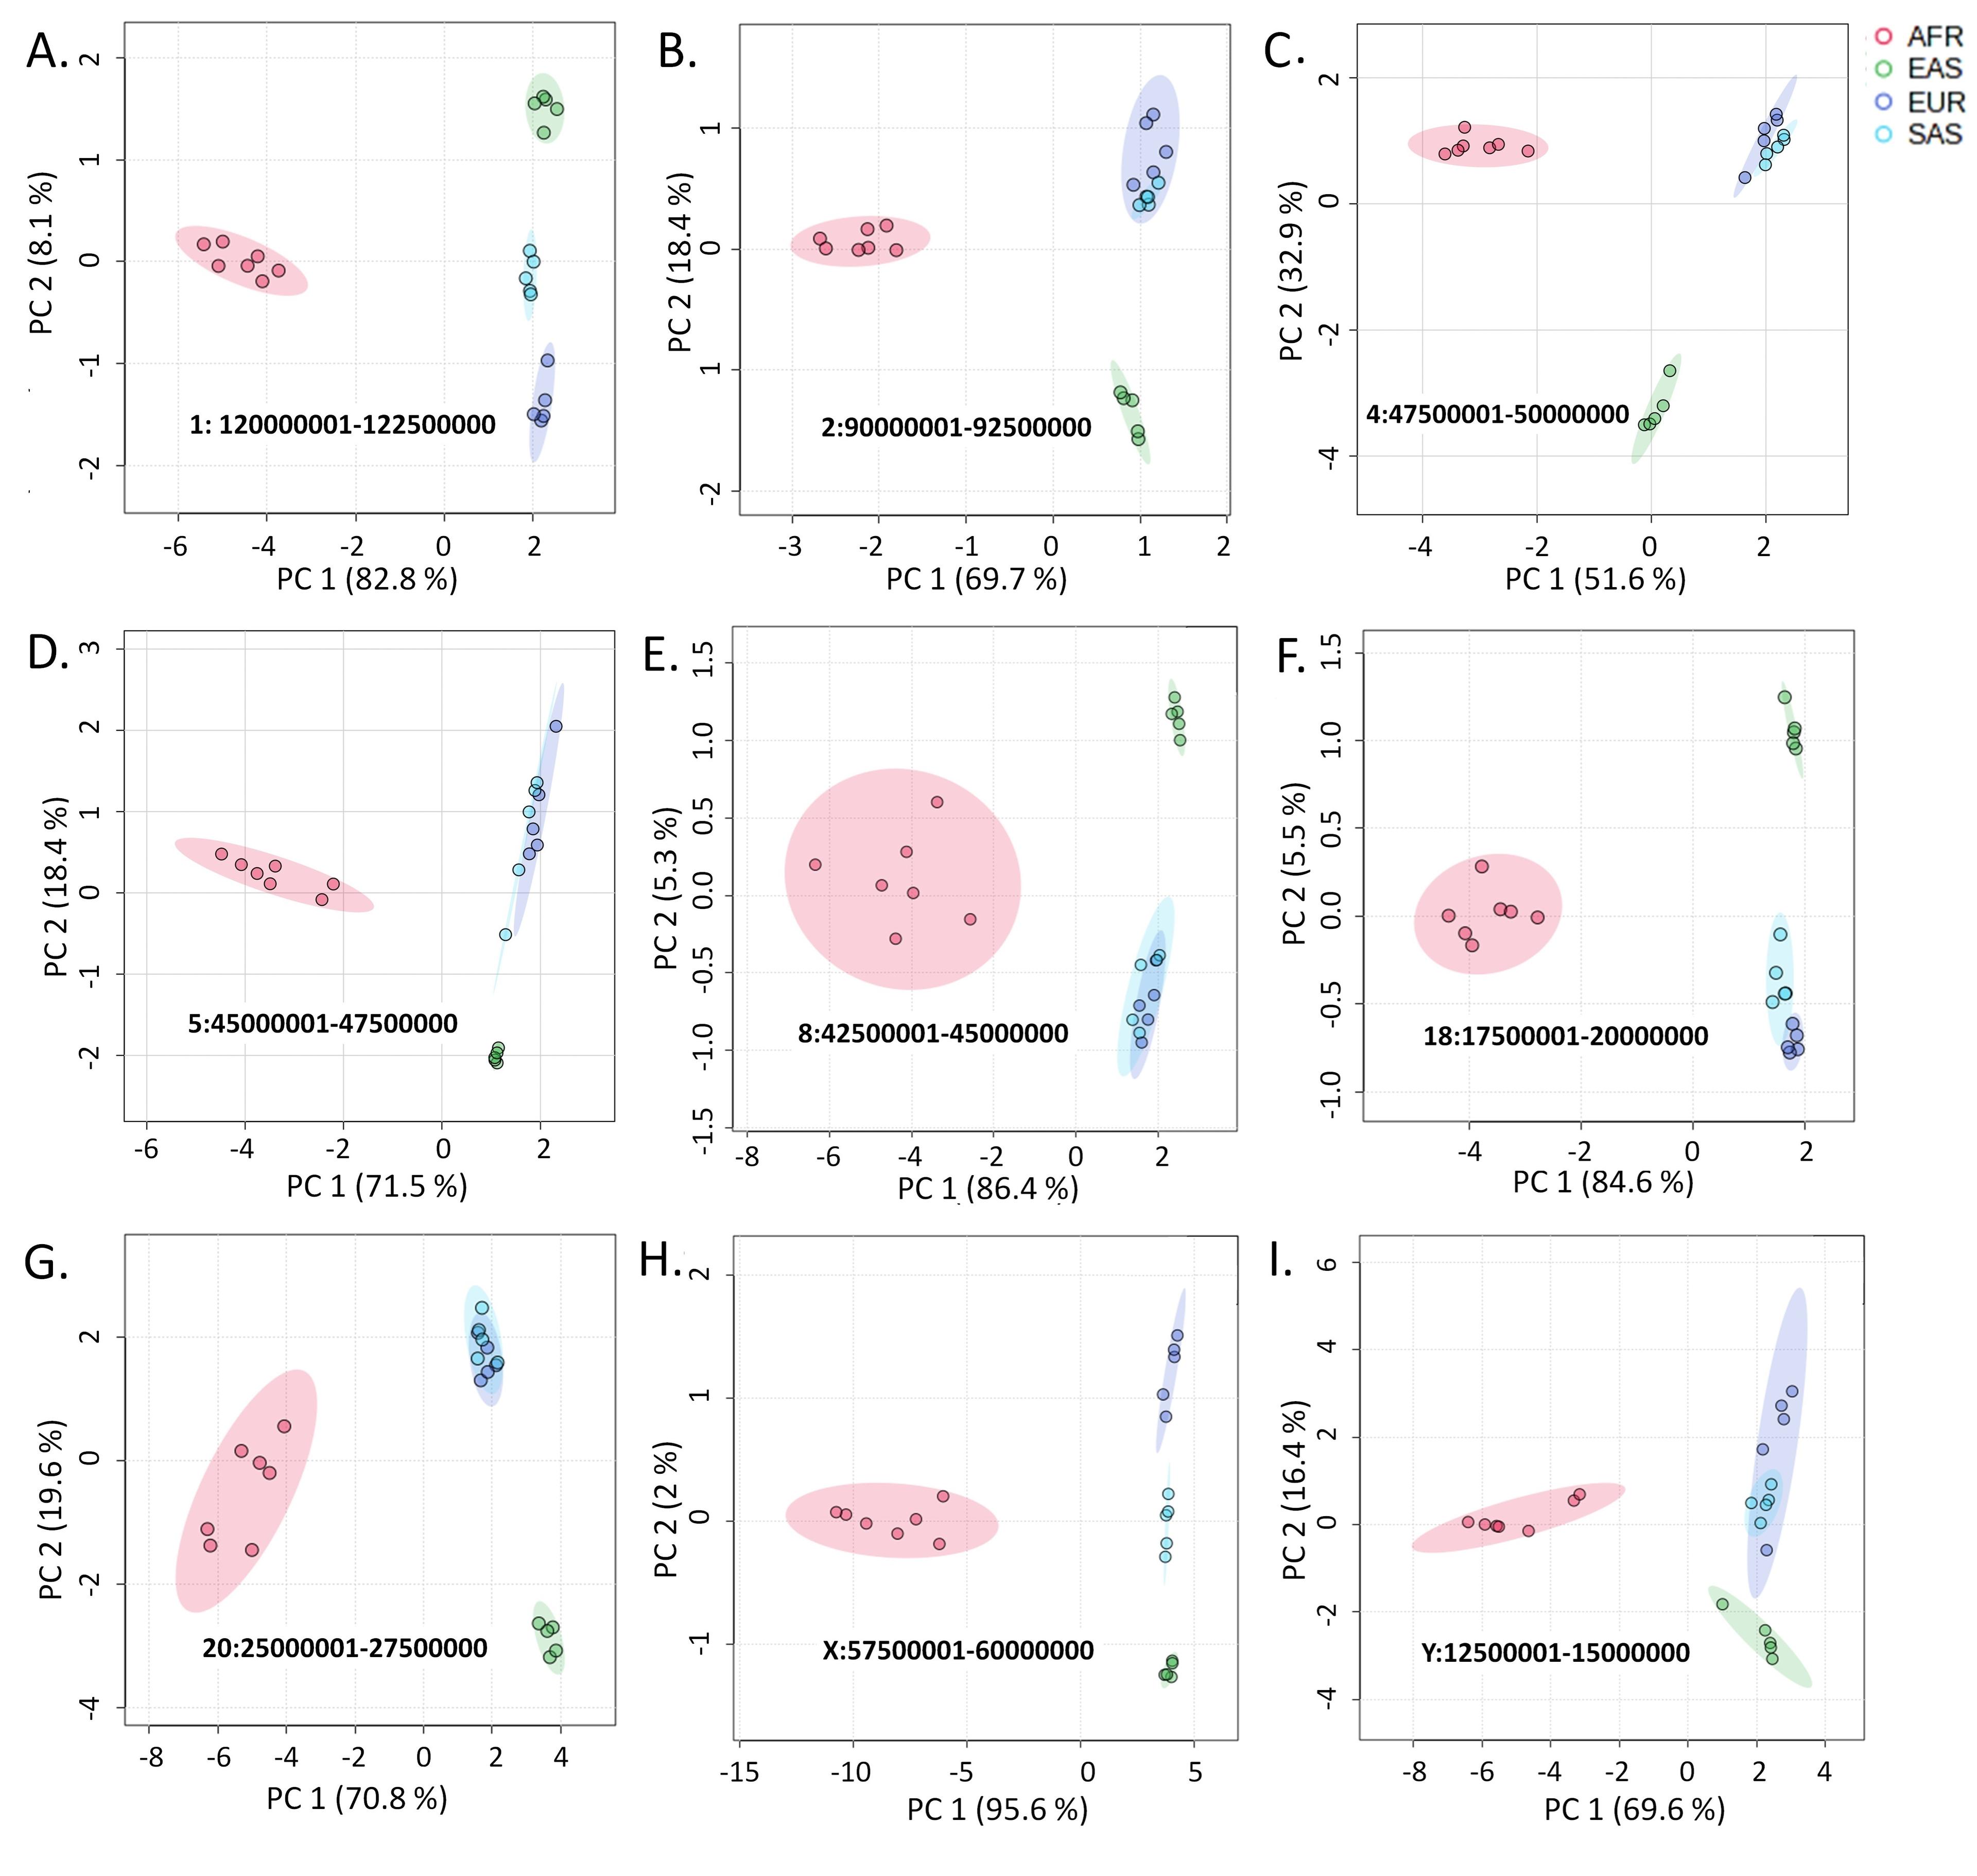
By analyzing over 75 million SNVs and InDels among 22 populations distributed in four geographic regions through principal component analysis and hierarchical clustering in a total of 1146 plots, we have identified a notable pattern difference between variants of the autosomes and X chromosome with those of the Y chromosome. In the PCA plots, the allele frequencies at the variant loci in all autosomes and the X chromosome cluster the populations based on the geographic locations (Figure 1). In these plots, AFR populations remain closely clustered and positioned distantly from the other populations. The EAS populations also exhibit more or less close clusters, although, unlike the AFR populations, the cluster positions were not strictly distinctive.
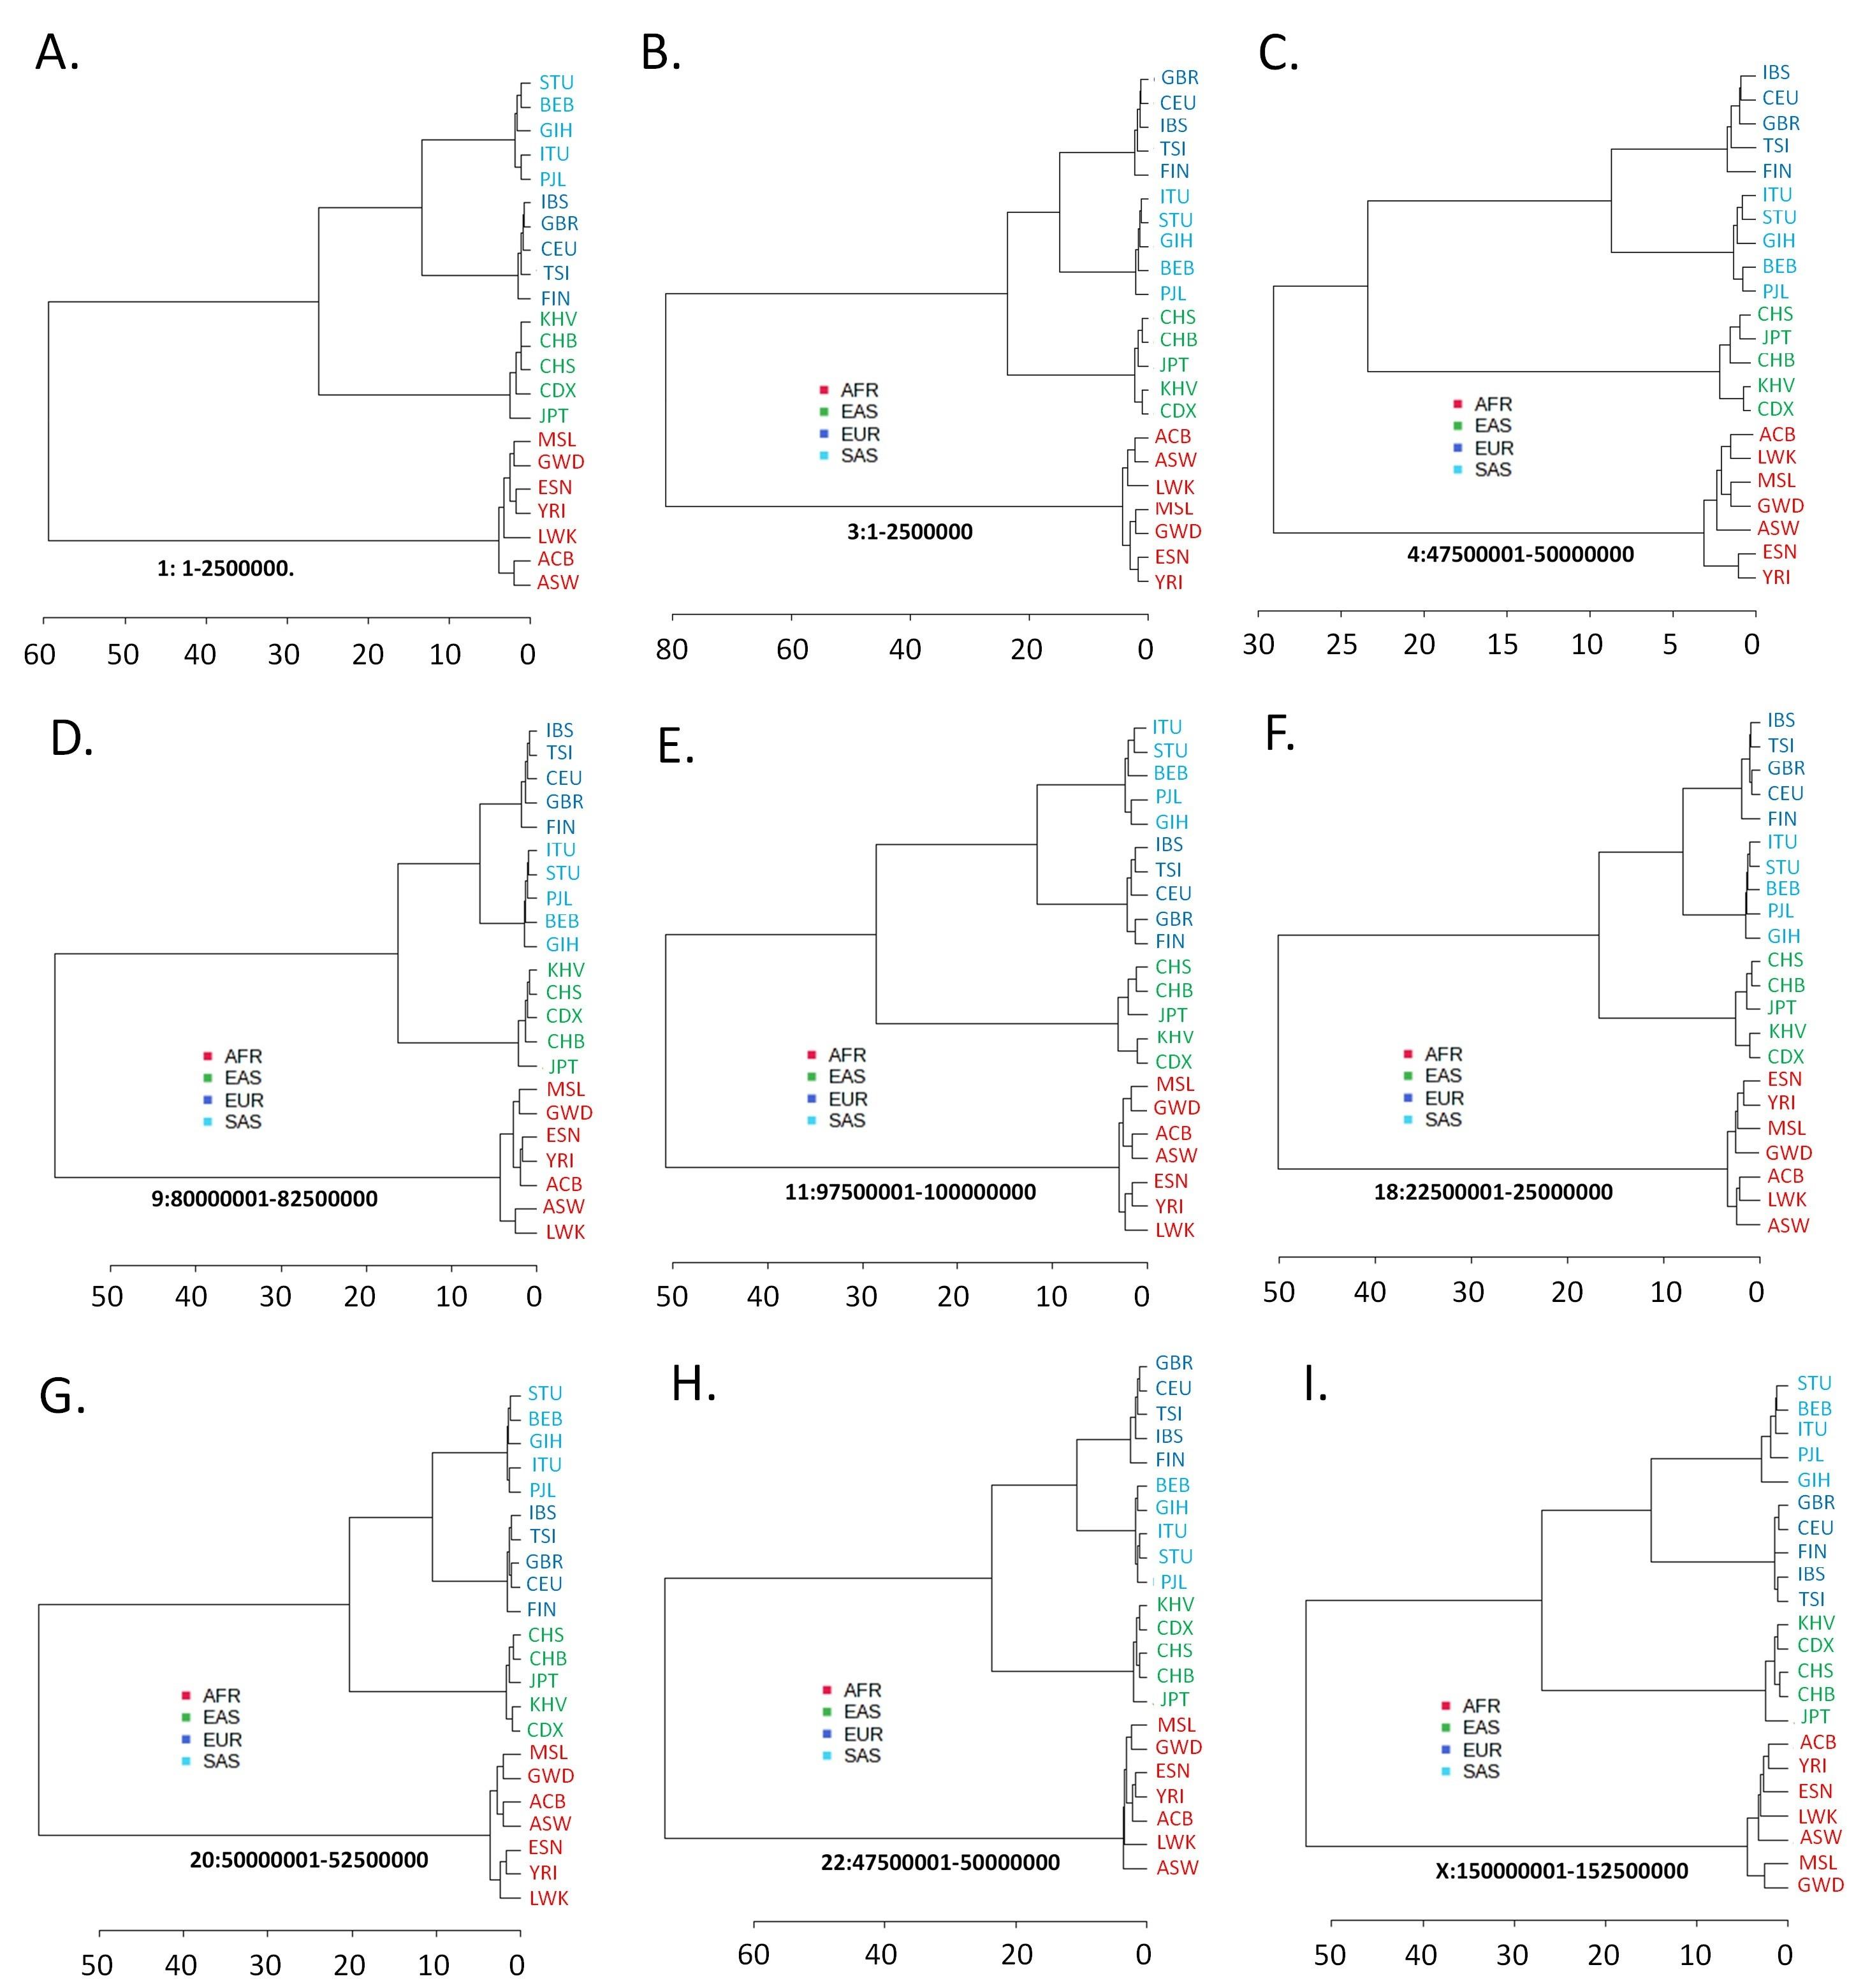
In population dendrograms, too, the AFR populations form a distinct and separate clade, while the other populations appear in a second clade (Figure 2). The SAS and EUR populations generally share a single node in this latter branch for both the autosomal and the X chromosomal variants. This pattern significantly portrays that the SAS and EUR populations have higher similarities in their autosomal and X chromosomal genetic material (Figure 2).
Clustering based on the variants on the Y chromosome
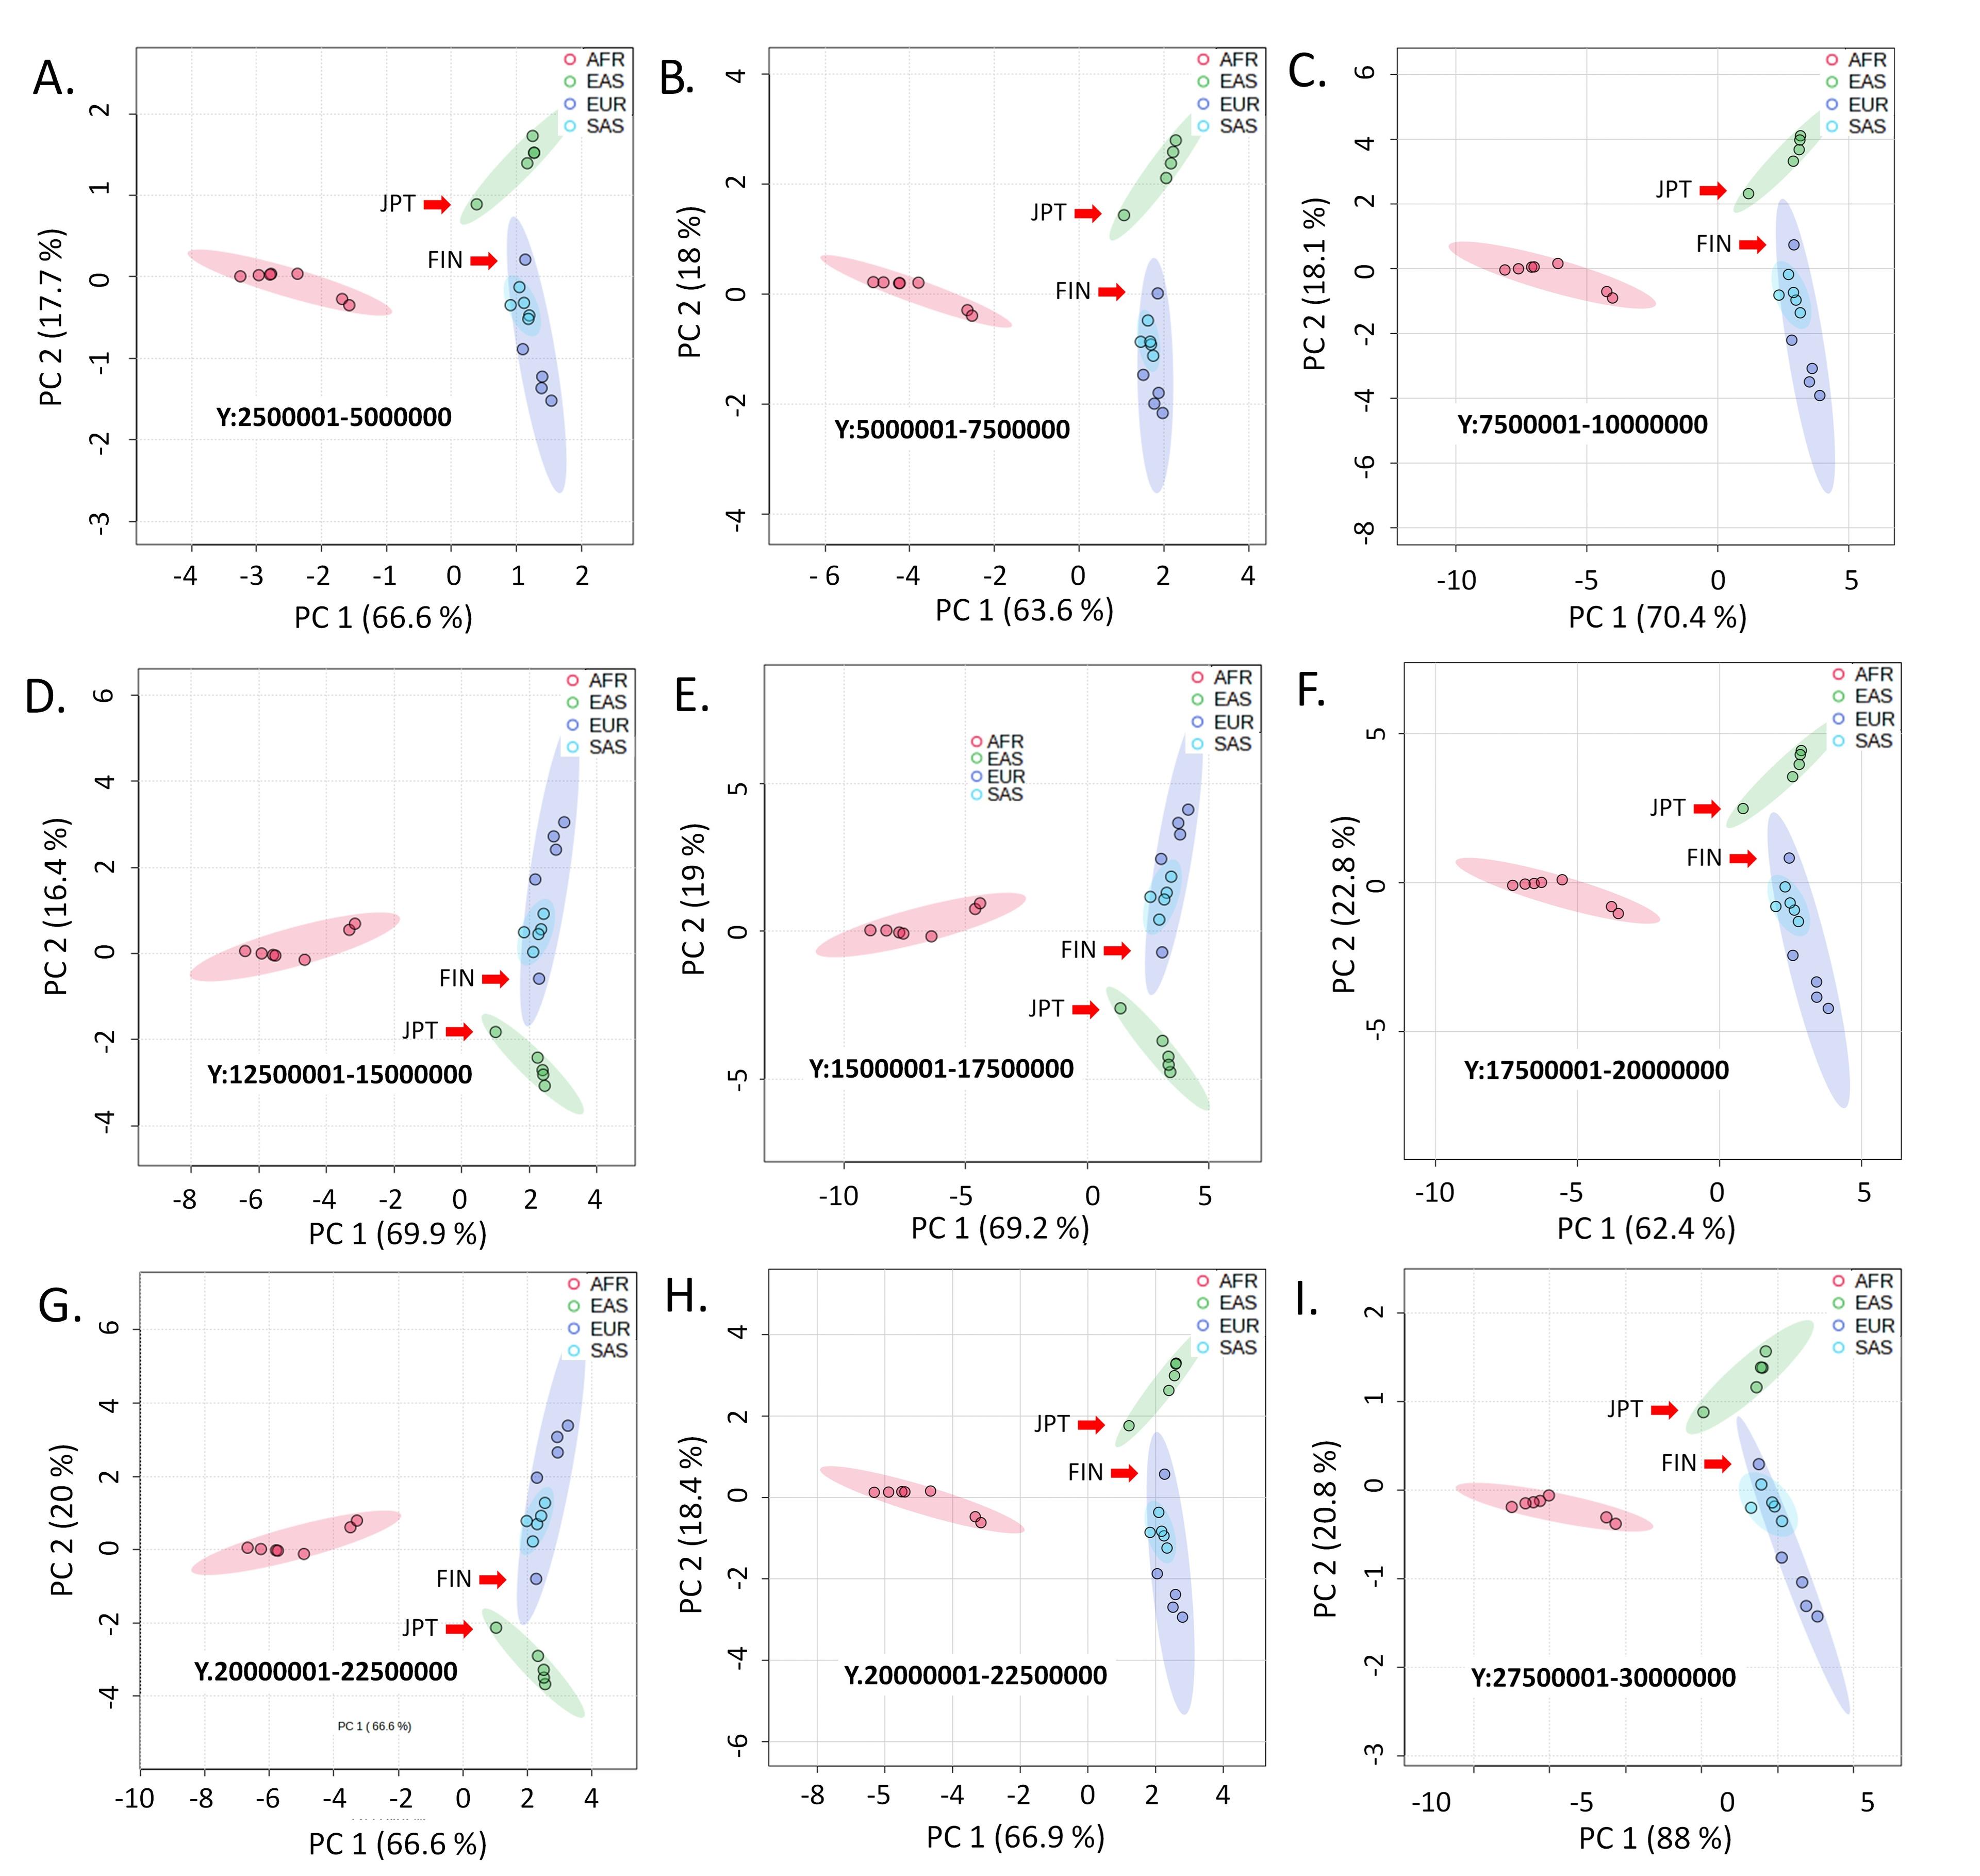
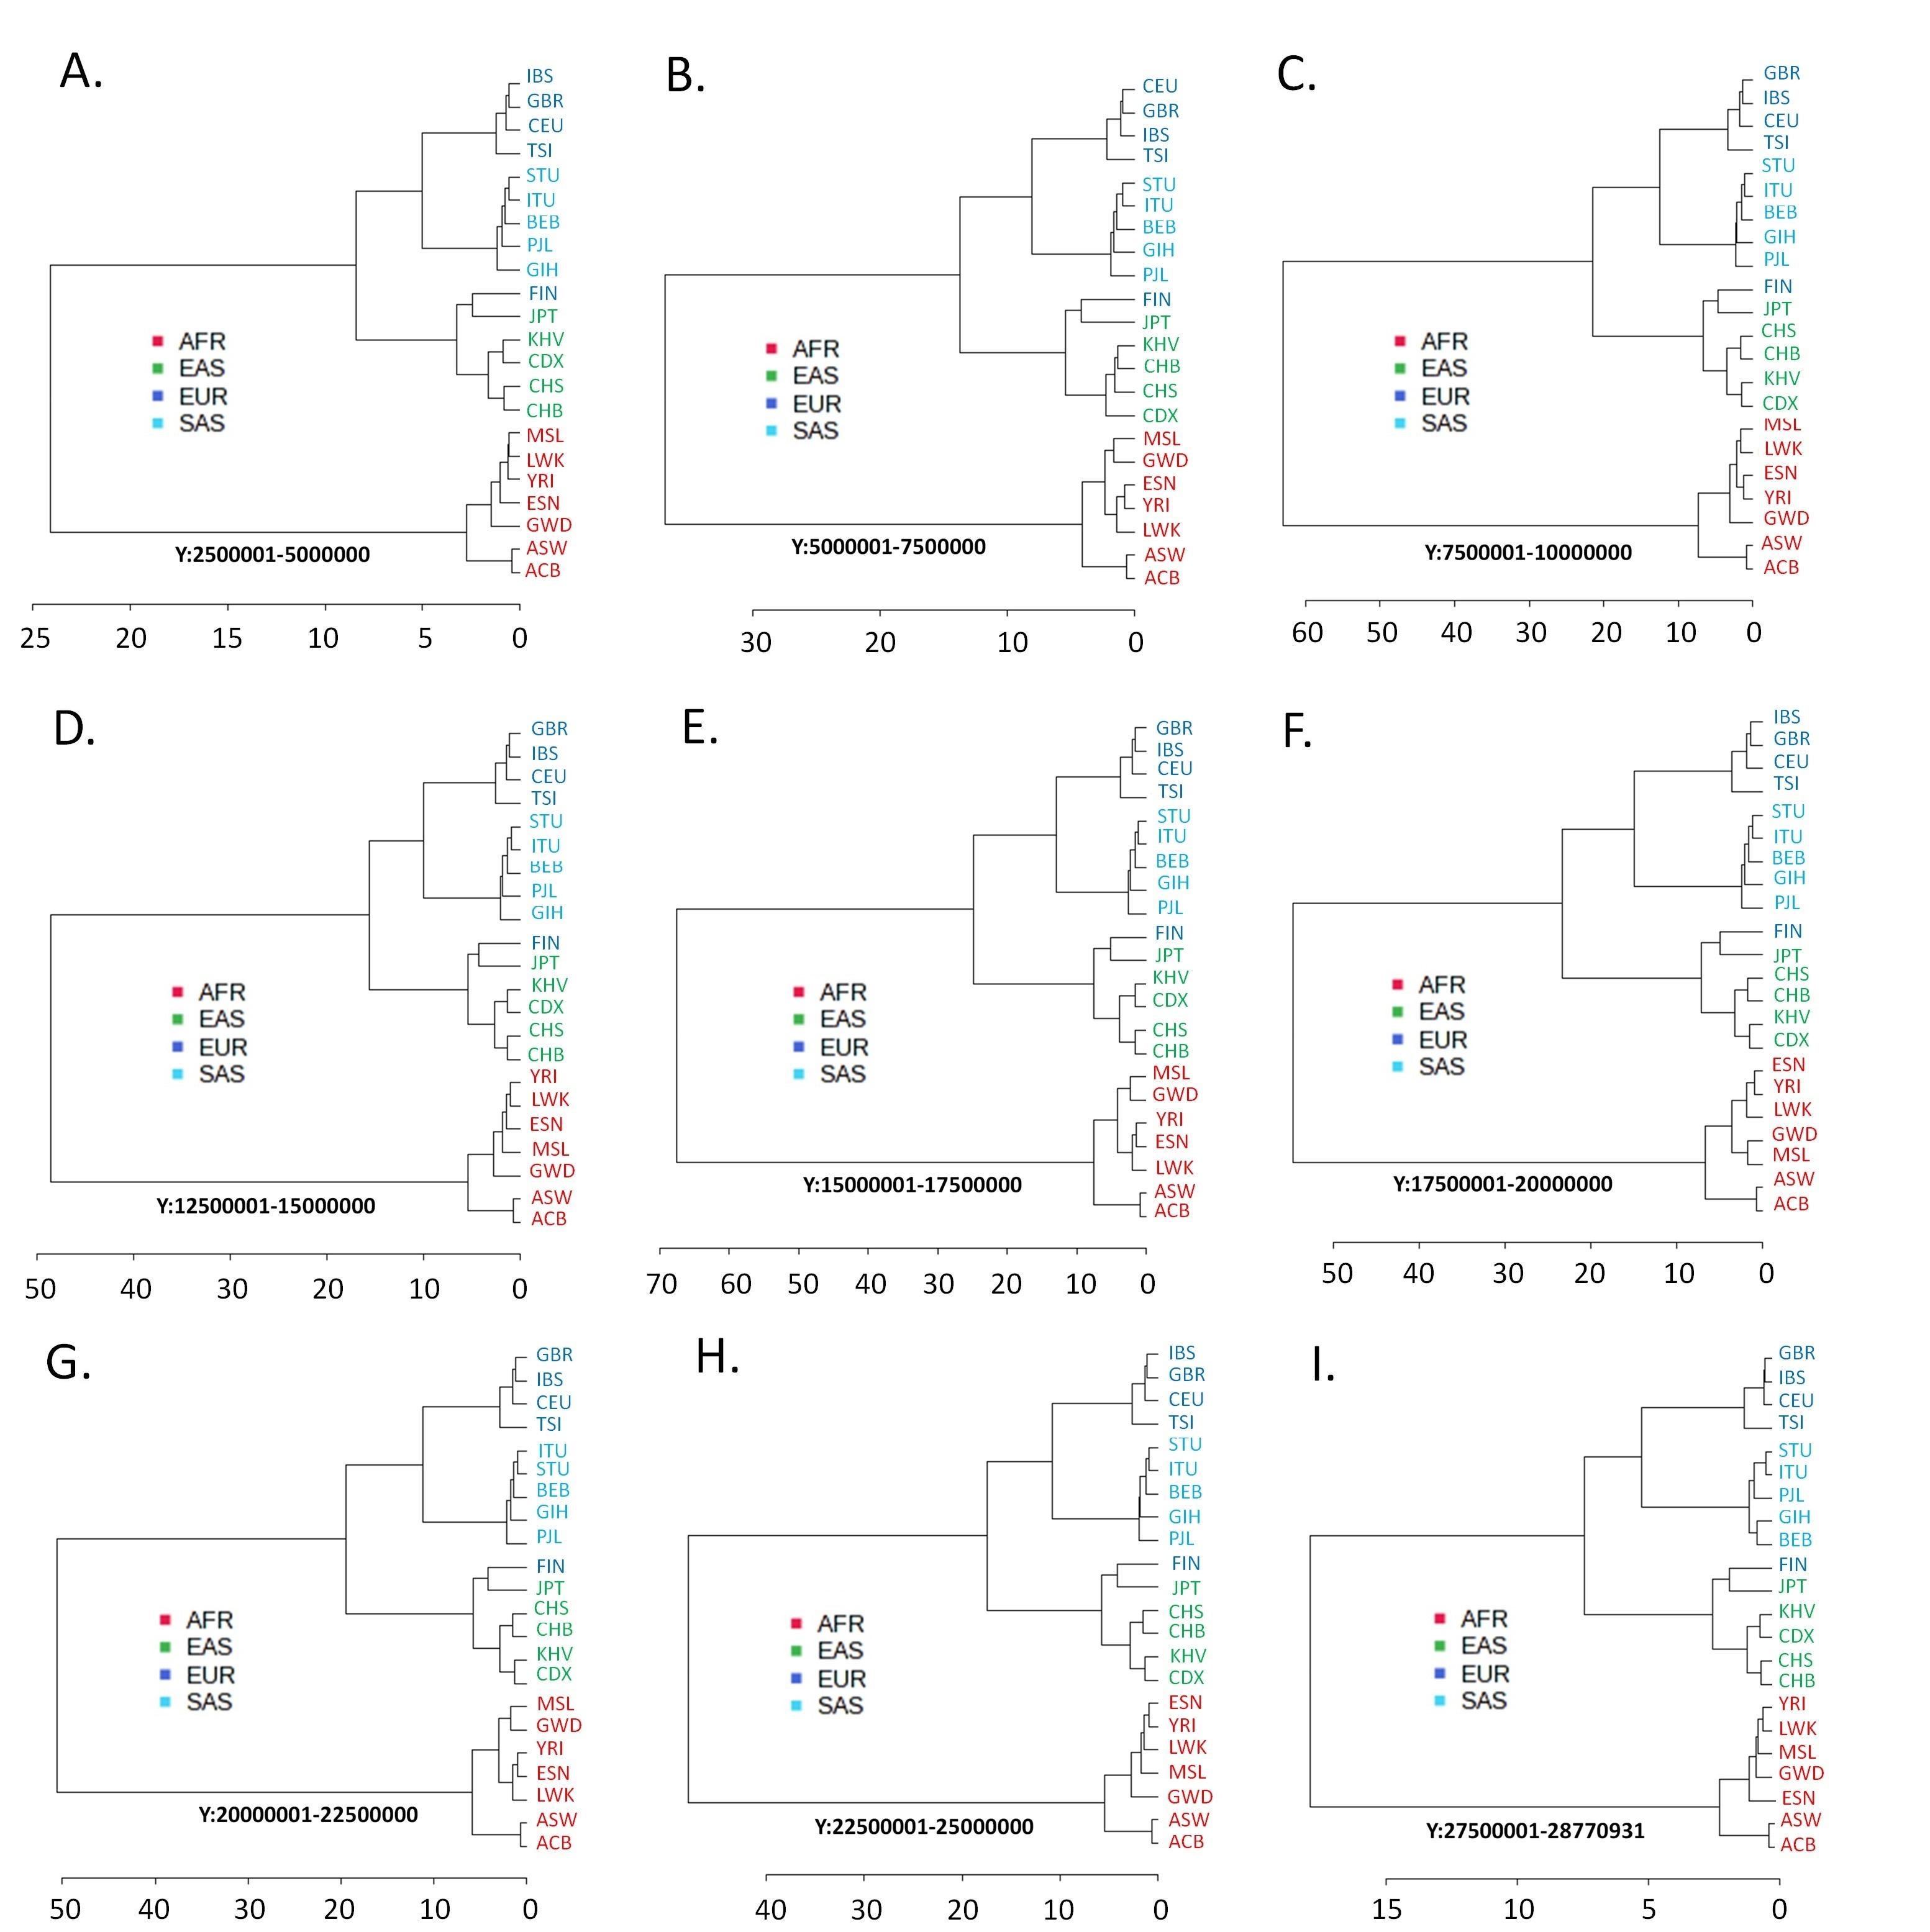
Like the autosomes and the X chromosome variants, the allele frequencies at the Y chromosome variant loci cluster the AFR populations together (Figure 3). The common observation from the variants of the Y chromosome is that the SAS populations and the EUR populations, except the Finnish (FIN) population, emerge from the common node in the dendrograms (Figure 4). A distinctive clustering pattern of the Y chromosomal variants is observed for the Japanese (JPT) and the FIN populations. The FIN population of the EUR superpopulation separately clusters with the JPT population, which belongs to the EAS superpopulation (Figure 4). Only Y chromosome variants exhibit this specific clustering pattern.
Clustering based on the variants around the centromere of the chromosomes
The regions of centromeres constitute common heterochromatin sites in chromosomes and the loci near centromeres exhibit low levels of recombination [18-20]. Coordinates of centromeric regions in different chromosomes are shown in supplementary table 4. The variants at loci encompassing the regions of the centromere cluster the populations of the similar geographic regions together (Figure 5). However, in many of these plots, the EUR and the SAS populations cluster very close- a pattern observed with the Y-chromosome variants (Figure 3), which might be indicative of the comparatively more genetic relatedness between EUR and SAS populations.
DISCUSSION
The 22 autosomes constitute the major portion of the human genome. By incorporating and analyzing autosomal variants along with non-autosomal variants, we produced an extensive genome-wide study to interpret human geographical ancestry more persuasively. We observed that autosomal and X-chromosomal variants cluster differently than Y-chromosomal variants, not at random, but rather consistently. The clustering pattern with autosomal and X-chromosomal variants (Figures 1 and 2) reiterates the fossil and genetic evidence [21-23] suggesting that anatomically, modern humans evolved in Africa and then migrated into Europe and Asia in an approximately West-to-East pattern. Geographic isolation, interbreeding, and adaptation in new environments later differentiated human populations from each other [24]. EUR and SAS populations have been reported to be more related in multiple studies [10, 25-27]. There is greater Neanderthal mixing in EAS populations than in EUR populations, and part of it occurred after East Asians and Europeans separated [28-30].
Mitochondrial DNA, having a small circular genome with a higher mutation rate than nuclear DNA, serves as a potential marker to identify the migration pattern of humans. As the mitochondrial genome is inherited solely from the mother, it essentially helps to understand the maternal ancestry, thereby the pattern of migration in light of movement and inheritance of female genetic material. In comparison to mitochondrial markers, Y chromosomal markers offer several advantages as ancestry markers. The Y chromosome contains a wide range of polymorphisms such as base substitution, indels, duplication, and inversion due to its larger size and higher complexity than those of mitochondrial DNA [31]. Y chromosomal DNA regions have a lower mutation rate compared to that of the mitochondrial genome. The lower mutation rate of the Y chromosome helps to ascertain the ancestry of humans more accurately, as these mutations pass down to the descendants more stably [32]. Therefore, polymorphisms found in the Y chromosomes have emerged as important markers to distinguish human genetic diversity according to geographic locations. Also, Y chromosomal regions do not undergo recombination like the other parts of the human genome, such as the autosomes and X chromosome [33, 34], which may explain the close clustering of the EUR and SAS populations for the variants in the Y-chromosomal and the near-centromeric regions of other chromosomes (Figures 3 and 5).
This study reveals an intriguing pattern in the Y chromosomal variants, leading to a notable distinction in the hierarchical clustering patterns between the Y chromosomal and other chromosomal variants (Figure 4). Specifically, the FIN population, distinct from other EUR populations, consistently aligns with the JPT population, a part of the EAS super population. For the autosomal and X-chromosomal variants, this pattern is not completely absent. There is archaeological and cultural evidence that might support this clustering pattern. In the past, Finnish people spoke the Uralic language, which is distinct from the Indo-European languages generally spoken by Europeans. The Uralic language group was previously known as Finno-Ugric, which originated in north-central Asia. Also, a study of Y chromosome markers showed that Europeans who speak Uralic languages share Y-chromosome haplotypes with people from central and northeastern Asia, indicating a significant paternal genetic contribution from Asia to these northern European populations [35]. The sea plays an enormous role in Japanese culture, history, society, art, and identity. The Pacific Ocean, the Sea of Okhotsk, the Sea of Japan, and the East China Sea surround Japan. Human habitation in Japan certainly occurred by sea routes [36]. Is it possible that during any such voyage, a group of the early ancestors of the Japanese population, dominated mostly by males, set foot on a European coast?
Estimation of the ancestry of individuals based on their genetic inheritance is an emerging area of research. Understanding human migration routes and history in light of the genetic structure of the populations can be a great way to hypothesize and comprehend how the individuals of a population are susceptible to any disease. Many studies have already found that susceptibility to diseases varies from population to population. For example, individuals from African lineages have been identified as having a greater susceptibility to asthma compared to those of European descent [37]. Again, people of African ancestry are more susceptible to encountering strokes as a consequence of cardiovascular diseases, whereas individuals of South Asian descent are more likely to suffer from heart attacks [38]. Also, infectious diseases with higher prevalence and extensive geographic distributions may induce substantial genetic variation in susceptibility [39-41].
This study only analyzed the genome-wide variant data available for 2,504 people from 22 populations in four major geographic regions. The inclusion of more samples from a wider number of populations from different geographic regions would give a more complete picture of the trajectory of human migration.
CONCLUSIONS
The current investigation reveals distinct differences in population-specific clustering patterns of genetic variants that reside on the Y and other chromosomes. Finally, this comprehensive analysis of autosomal and non-autosomal variants brought additional perspectives to the human migration trajectory.
ACKNOWLEDGEMENTS
This study was supported by grants (Grant No. 2022-2023) from the University Grants Commission (UGC), Bangladesh in the University of Dhaka. The authors are thankful for the support.
AUTHOR CONTRIBUTIONS
SST: Investigation, methodology, writing; JS: Investigation, methodology, writing; MSR: Data curation; AB: Investigation, methodology; RN: Investigation, methodology; TA: Investigation, methodology; MWM: Methodology, reviewing; AAS: Conceptualization, fund acquisition, project administration, resources, supervision, reviewing. All authors have approved the final version of the manuscript.
CONFLICTS OF INTEREST
There is no conflict of interest among the authors.
SUPPLEMENTARY MATERIALS
Supplementary Table 1. List of populations with their geographic distribution, Supplementary Table 2. Python code for rearranging the columns of the data files, Supplementary Table 3. An example of the data format, and Supplementary Table 4. Chromosomal position of centromeres (Supplementary materials).
References
- [1]Smith TM, Tafforeau P, et al. Earliest evidence of modern human life history in north african early homo sapiens. Proceedings of the National Academy of Sciences of the United States of America. 2007;104:6128-33.
- [2]Scerri EML, Chikhi L, et al. Beyond multiregional and simple out-of-africa models of human evolution. Nat Ecol Evol. 2019;3:1370-2.
- [3]Oppenheimer S. Out-of-africa, the peopling of continents and islands: Tracing uniparental gene trees across the map. Philos Trans R Soc Lond B Biol Sci. 2012;367:770-84.
- [4]Bae CJ, Douka K, et al. On the origin of modern humans: Asian perspectives. Science. 2017;358:eaai9067.
- [5]López S, van Dorp L, et al. Human dispersal out of africa: A lasting debate. Evolutionary bioinformatics online. 2016;11:57-68.
- [6]Endicott P, Metspalu M, et al. Genetic evidence on modern human dispersals in south asia: Y chromosome and mitochondrial DNA perspectives: The world through the eyes of two haploid genomes. In: Petraglia MD, Allchin B, editors. The evolution and history of human populations in south asia vertebrate paleobiology and paleoanthropology series. Dordrecht: Springer; 2007.
- [7]Stanyon R, Sazzini M, et al. Timing the first human migration into eastern asia. J Biol. 2009;8:18.
- [8]Stoneking M, Delfin F. The human genetic history of east asia: Weaving a complex tapestry. Curr Biol. 2010;20:R188-93.
- [9]Underhill PA, Kivisild T. Use of y chromosome and mitochondrial DNA population structure in tracing human migrations. Annu Rev Genet 2007;41:539-64.
- [10]Ahsan T, Urmi NJ, et al. Heterogeneity in the distribution of 159 drug-response related snps in world populations and their genetic relatedness. PloS one. 2020;15:e0228000.
- [11]Kersbergen P, van Duijn K, et al. Developing a set of ancestry-sensitive DNA markers reflecting continental origins of humans. BMC Genet. 2009;10:69.
- [12]Badro DA, Douaihy B, et al. Y-chromosome and mtdna genetics reveal significant contrasts in affinities of modern middle eastern populations with european and african populations. PloS one. 2013;8:e54616.
- [13]Wen B, Xie X, et al. Analyses of genetic structure of tibeto-burman populations reveals sex-biased admixture in southern tibeto-burmans. Am J Hum Genet. 2004;74:856-65.
- [14]Hunt SE, McLaren W, et al. Ensembl variation resources. Database (Oxford). 2018;2018::bay119.
- [15]Auton A, Brooks LD, et al. A global reference for human genetic variation. Nature. 2015;526:68-74.
- [16]Nassar LR, Barber GP, et al. The ucsc genome browser database: 2023 update. Nucleic Acids Res. 2023;51:D1188-D95.
- [17]Pang Z, Chong J, et al. Metaboanalyst 5.0: Narrowing the gap between raw spectra and functional insights. Nucleic Acids Res. 2021;49:W388-W96.
- [18]Carneiro M, Ferrand N, et al. Recombination and speciation: Loci near centromeres are more differentiated than loci near telomeres between subspecies of the european rabbit (oryctolagus cuniculus). Genetics. 2009;181:593-606.
- [19]Stump AD, Fitzpatrick MC, et al. Centromere-proximal differentiation and speciation in anopheles gambiae. Proceedings of the National Academy of Sciences of the United States of America. 2005;102:15930-5.
- [20]Schreiber M, Gao Y, et al. Recombination landscape divergence between populations is marked by larger low-recombining regions in domesticated rye. Mol Biol Evol. 2022;39:msac131.
- [21]Norris ET, Wang L, et al. Genetic ancestry, admixture and health determinants in latin america. BMC genomics. 2018;19:861.
- [22]Rotimi CN, Bentley AR, et al. The genomic landscape of african populations in health and disease. Hum Mol Genet. 2017;26:R225-R36.
- [23]Tishkoff SA, Reed FA, et al. The genetic structure and history of africans and african americans. Science. 2009;324:1035-44.
- [24]Hellwege JN, Keaton JM, et al. Population stratification in genetic association studies. Curr Protoc Hum Genet. 2017;95:1.22.1-1..3.
- [25]Li JZ, Absher DM, et al. Worldwide human relationships inferred from genome-wide patterns of variation. Science. 2008;319:1100-4.
- [26]Visscher H, Ross CJ, et al. Application of principal component analysis to pharmacogenomic studies in canada. Pharmacogenomics J. 2009;9:362-72.
- [27]Xu S. Human population admixture in asia. Genomics Inform. 2012;10:133-44.
- [28]Kim BY, Lohmueller KE. Selection and reduced population size cannot explain higher amounts of neandertal ancestry in east asian than in european human populations. Am J Hum Genet. 2015;96:454-61.
- [29]Villanea FA, Schraiber JG. Multiple episodes of interbreeding between neanderthal and modern humans. Nat Ecol Evol. 2019;3:39-44.
- [30]Wall JD, Yang MA, et al. Higher levels of neanderthal ancestry in east asians than in europeans. Genetics. 2013;194:199-209.
- [31]Jobling MA, Tyler-Smith C. Fathers and sons: The y chromosome and human evolution. Trends Genet. 1995;11:449-56.
- [32]Xue Y, Wang Q, et al. Human y chromosome base-substitution mutation rate measured by direct sequencing in a deep-rooting pedigree. Curr Biol. 2009;19:1453-7.
- [33]Syndercombe Court D. The y chromosome and its use in forensic DNA analysis. Emerg Top Life Sci. 2021;5:427-41.
- [34]Gubbay J, Lovell-Badge R. The mouse y chromosome. In: Wachtel SS, editor. Molecular genetics of sex determination: Academic Press; 1994. p. 43-67.
- [35]Zerjal T, Dashnyam B, et al. Genetic relationships of asians and northern europeans, revealed by y-chromosomal DNA analysis. Am J Hum Genet. 1997;60:1174-83.
- [36]Bestor V, Bestor TC, et al. Routledge handbook of japanese culture and society: Routledge; 2011.
- [37]Vergara C, Caraballo L, et al. African ancestry is associated with risk of asthma and high total serum ige in a population from the caribbean coast of colombia. Hum Genet. 2009;125:565-79.
- [38]Das R, Tatarinova TV, et al. Editorial: Association between individuals' genomic ancestry and variation in disease susceptibility. Front Genet 2022;13:831320.
- [39]Baker C, Antonovics J. Evolutionary determinants of genetic variation in susceptibility to infectious diseases in humans. PloS one. 2012;7:e29089.
- [40]Ahsan T, Fatema K, et al. Ethnic disparities in the distribution of gene expression modulating polymorphisms in key pro-inflammatory cytokines associated with covid-19 severities. Journal of Bangladesh Academy of Sciences. 2023;47:69–90.
- [41]Shoily SS, Ahsan T, et al. Disparities in covid-19 severities and casualties across ethnic groups around the globe and patterns of ace2 and pir variants. Infect Genet Evol. 2021;92:104888.