Metabolomic signatures of Ramadan diurnal intermittent fasting in type 2 diabetes mellitus
Abstract
The global prevalence of type 2 diabetes mellitus (T2DM) is on the rise and projections indicate that an alarming portion of the population will be affected by this disease in the coming decades. In T2DM, chronic hyperglycemia affects the metabolism of the human body. Previous studies on how diabetes impacts metabolism have yielded contradictory results. Therefore, to gain a deeper comprehension of the pathophysiology and progression of diabetes, it is crucial to pinpoint the dysregulated metabolism caused by the disease. In this study, we investigated the alterations in global metabolism in diabetic patients, as well as the effect of Ramadan diurnal intermittent fasting (RDIF) on metabolism. The levels of metabolites that are significantly different in diabetic individuals are components of five pathways: purine metabolism, cysteine and methionine metabolism, arginine and proline metabolism, porphyrin metabolism, and riboflavin metabolism. In diabetic individuals, RDIF significantly altered metabolite levels, affecting three pathways in particular: the pentose phosphate pathway, the tyrosine metabolism, and the D-arginine and D-ornithine metabolism. These pathways share genes previously linked to glycemic control and diabetes. Altogether, this study provides more insight into the beneficial effects of diurnal fasting in controlling diabetes.
INTRODUCTION
Insulin, a postprandial hormone, regulates glucose, protein, and lipid metabolism in the human body and thus ensures metabolic homeostasis [1]. Defective insulin secretion by pancreatic β cells and/or insulin resistance in tissues results in the pathogenesis of type 2 diabetes mellitus (T2DM), one of the most common metabolic disorders [2]. T2DM is caused by complex interactions between genetic factors, as well as environmental components such as physical activity, nutrition, and pollution [3, 4]. The intricate interplay of these factors affects T2DM prevention and treatment [5].
According to the IDF Diabetes Atlas (2021), diabetes affects approximately 537 million individuals aged 20 to 79 years. This chronic disease negatively impacts the quality of life of hundreds of millions of individuals around the world while also raising healthcare expenses. According to projections, one in every eight adults, or 783 million people, will develop diabetes by 2045, marking a 46% increase. Diabetes affects more than 13 million persons in Bangladesh, aged 20 to 79 years. Projections estimate an increase to over 17 million by 2030 and more than 22 million by 2045 [6].
Ramadan diurnal intermittent fasting (RDIF) is the abstinence from eating or drinking from sunrise to sunset in the ninth month of the lunar calendar [7]. The RDIF model has been shown to have many beneficial impacts on biochemical and metabolic health. These advantages include improvements in metabolic syndrome components [8], reductions in oxidative stress and inflammatory markers [9, 10], maintenance of glucose homeostasis [11], and reductions in cardio-metabolic risk factors [12], in healthy individuals. Intermittent fasting may also have beneficial immunomodulatory effects to relieve symptoms of SARS-CoV-2 infection [13]. Another investigation using proteome analysis found that implementing the dawn-to-dusk intermittent fasting approach for thirty days resulted in observable changes in protein expression [14]. This IF model was discovered to be connected with an anticancer proteomic signature and the activation of critical regulatory proteins associated with lipid and glucose metabolism, the immune system, and DNA repair in healthy individuals [14]. For example, it was discovered that the cofilin 1 (CFL1) gene product increases approximately 21-fold after one week of intermittent fasting [14]. CFL1 regulates glucose absorption via insulin-induced glucose transporter 4 (GLUT4) translocation [15]. These reported proteomic changes observed during Ramadan inevitably manifest in the metabolic landscape of the human body, necessitating further exploration through advanced metabolomic techniques.
Linus Pauling et al. suggested that insights can be obtained about an individual’s physiological state through qualitative and quantitative metabolite patterns [16]. These metabolites are generated during anabolism or catabolism and usually include compounds less than 1500 Da in molecular mass. Among these, peptides, fatty acids, lipids, amino acids, sugars, nucleic acids, xenobiotics, and exogenous toxins are the predominant ones [17]. Understanding metabolite alterations in relation to T2DM development and outcome is critical, given the dysregulation of multiple metabolic pathways.
Identification of broad-spectrum putative biomarker metabolites frequently yields contradictory results. For example, several studies have linked high quantities of certain amino acids to insulin resistance and diabetes [18]. Other studies have found conflicting data indicating lower amounts of certain amino acids in diabetics [19]. It is unclear whether these connections between insulin resistance and T2DM are causal or consequential. As a result, the goal of our study is to gain a better understanding of the changes in metabolites and affected pathways caused by diabetes and intermittent fasting, with a focus on the differences in responses between control and diabetic groups.
MATERIALS AND METHODS
Collection of study samples
This metabolomic study included a total of 21 adult female and male Bangladeshi individuals who expressed their willingness to fast during Ramadan. Eighteen of these individuals were diagnosed with diabetes, and the rest were non-diabetic healthy controls from Bangladesh. Blood samples were collected on two occasions- prior to and following intermittent fasting, with three replicates. As a result, a total of 126 (21 participants * 2 collection points * 3 replicates) extractions were performed. The Ethical Review Committee at the University of Dhaka provided ethical approval (Ref. No. 177/Biol.Scs) for this study.
A few drops of blood and relevant information were collected 1 week before Ramadan (pre-fasting) and only blood samples were collected again after ≥ 3 weeks of Ramadan (post-fasting) from corresponding participants. During Ramadan, the fasting individuals abstained from intake of foods and drinks (including water) as well as smoking from dawn to sunset. Following the disinfection of the fingertips with a 70% isopropyl alcohol pad and puncturing with a single-use needle, blood drops were collected in dried blood spot (DBS) cards (7078317 W162, GE Healthcare Ltd). DBS cards were dried at room temperature in the absence of any external source of heat. The presence of a uniform dark brownish color and no visible red areas indicated the completion of the drying process. These cards were put in gas-impermeable zipper bags and transferred to an ultra-low temperature freezer (DW-86L567T, LabTech) until further use.
Metabolite extraction
For the metabolite extraction process, 3 mm punches were cut from the DBS cards using a punching device. To ensure aseptic conditions and minimize the risk of contamination, both the punching device and forceps were carefully wiped with 70% (v/v) ethyl alcohol (1009831011, Merck) before and after each use.
The 3 mm punches were transferred to sterile 1.5 ml microcentrifuge tubes containing 100 µl of LC-MS grade water (51140, Thermo Fisher Scientific, USA). The tubes were shaken for 15 minutes at 1400 revolutions per minute (rpm) in a shaker (IKA® VORTEX 4 Digital). Then 400 µl of LC-MS grade acetonitrile (>99.8%, Wako Pure Chemical Industries Ltd, Japan) was added to each tube and sonicated for 15 minutes at room temperature in a sonicator (WUC-A10H 230 V, Witeg). After shaking the tubes for another 60 minutes at 1200 rpm, these were incubated overnight at -80˚C freezer for protein precipitation. On the following day, the samples were thawed on ice before centrifugation at 10000 rpm for 10 minutes at 4˚C in a centrifuge machine (K1015R, Centurion Scientific Limited). After centrifugation, 100 µl of the supernatant-containing metabolites was transferred in a 1.5 ml microcentrifuge tube. Samples were diluted by 10 times through the addition of 900 µl of acetonitrile. 0.1% formic acid (066-05905, Fujifilm Wako Pure Chemical Corporation, Japan) was added to each sample. Finally, the diluted solution was filtered with 0.22 µm pore-sized Millipore™ membrane filter (GSWP04700, Millipore).
Mass spectrometry
The samples were degassed by incubating in an ultrasonic water bath (WUC-A10H 230 V, Witeg) for 10 minutes. The degassed samples were injected into the 3200MD QTRAP LC-MS/MS System (AB SCIEX) using the syringe pump method through a syringe of 4.6 mm in diameter. A global metabolic profile was generated with a mass-by-charge ratio starting from 0 m/z to 1200 m/z. The apparatus was cleaned using 100% LC-MS grade acetonitrile (439134, Sigma-Aldrich) between two runs. Blank runs were performed with LC-MS grade methanol (3041, Duksan Pure Chemicals). The parameters used in the MS analysis are as follows: Ionization method- electrospray ionization (ESI), curtain gas pressure- 25 MPa, ion spray voltage- 4500 V, temperature- 450⁰C, ion source gas pressure - 15 MPa, flow rate- 10 µl/minute, scan type - Q1MS(Q1), and polarity - positive.
Preprocessing and analysis of data
The raw MS data were exported to Excel files containing two columns: one for m/z values and the other for the corresponding intensity values. These Excel files were converted to the CSV (comma delimited) file format and formatted by employing a Python script. Further analysis was performed using the MetaboAnalyst platform [20].
The intensity of each m/z value was normalized by the Total Ion Current (sum of the intensities of all detected ions) of the corresponding sample. Data transformation was performed through the log transformation (base 10) method. Auto-scaling was also performed. The statistical tools available at MetaboAnalyst were used for statistical analysis.
Identification of metabolites
Metabolites with a fold change of more than 1.5 as well as p-value < 0.05 were selected as significantly altered between the two groups through volcano plot analysis. Then using the Compound Hit module (applying Mummichog algorithm) in the MetaboAnalyst and Kyoto Encyclopedia of Genes and Genomes (KEGG) database, some of these significantly altered metabolites were identified.
Identification of the metabolic pathway
The Functional Analysis module within the MetaboAnalyst platform was used to identify the biological pathways associated with a set of metabolites. The Mummichog algorithm was employed to identify pathway hits.
Identification of pathway crosstalk
Following the identification of enriched pathways, the catalog of genes associated with a specific pathway was acquired from the GitHub repository. The first-order protein-protein interaction network among the genes in a particular pathway was constructed through the web-based tool NetworkAnalyst 3.0 [21]. The network representations of all enriched pathways were imported into Cytoscape [22] in the Simple Interaction Format (SIF) and crosstalk among the pathways was identified.
RESULTS
During mass spectrometry, the observed charge generation was consistent at around 108 per second and remained stable throughout each run. The chromatogram, generated by Q1 mass, depicted the mass-to-charge ratio (m/z) of metabolites along with their corresponding peak intensities. Each sample yielded approximately 500 m/z values and their corresponding peak intensities.
Impact of diabetes on metabolism
The features exhibiting a change of more than 1.5-fold and possessing a p-value less than 0.05 were considered to be significantly altered. In comparison to non-diabetic samples, 30 features (m/z ratio) were significantly elevated and 102 features were significantly reduced in diabetic samples (Figure 1). Among these features, we could identify a certain number of significantly elevated and reduced metabolites which are outlined in Table 1.
The functional analysis module of MetaboAnalyst could identify five enriched pathways using the significantly elevated or reduced metabolites (Figure 2). These pathways were found to be significantly altered in diabetic individuals. All this information corresponding to the enriched pathway is listed in Table 2.
The merging of the gene networks of all five enriched pathways revealed a particular relationship between the arginine and proline metabolism pathway and the cysteine and methionine metabolism pathway. These two pathways shared a common set of 6 genes, as illustrated in Figure 3.
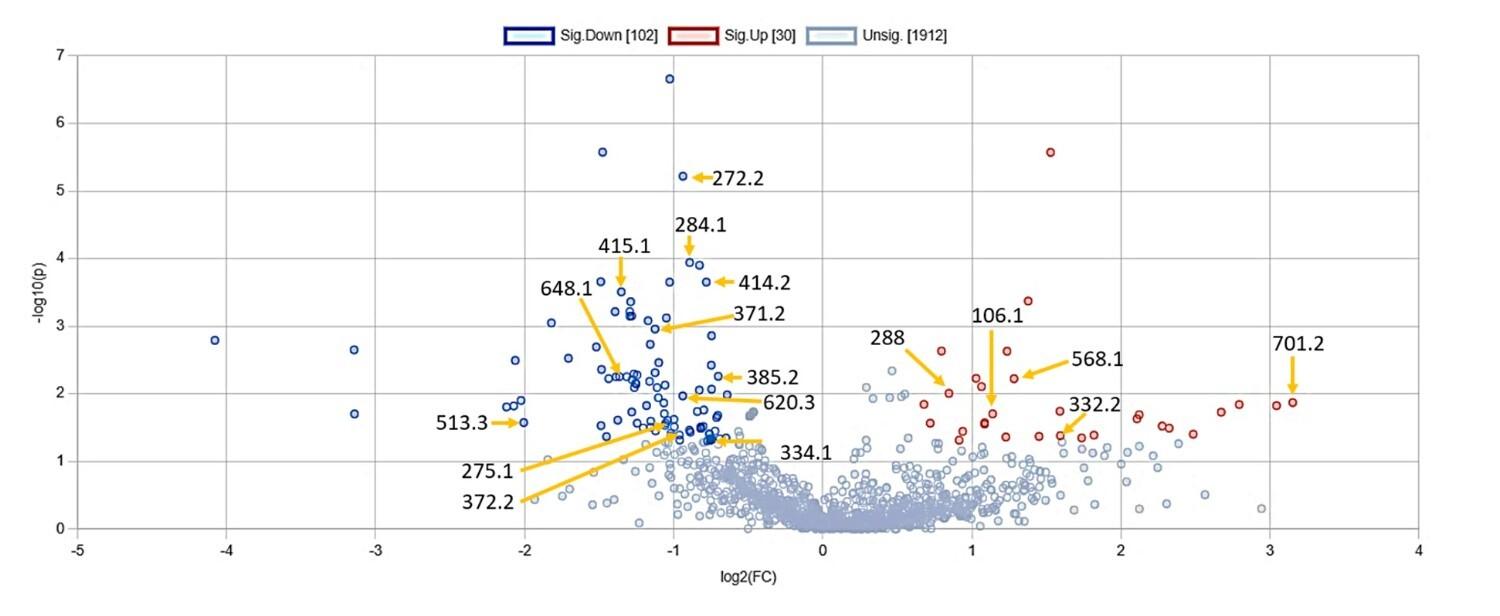
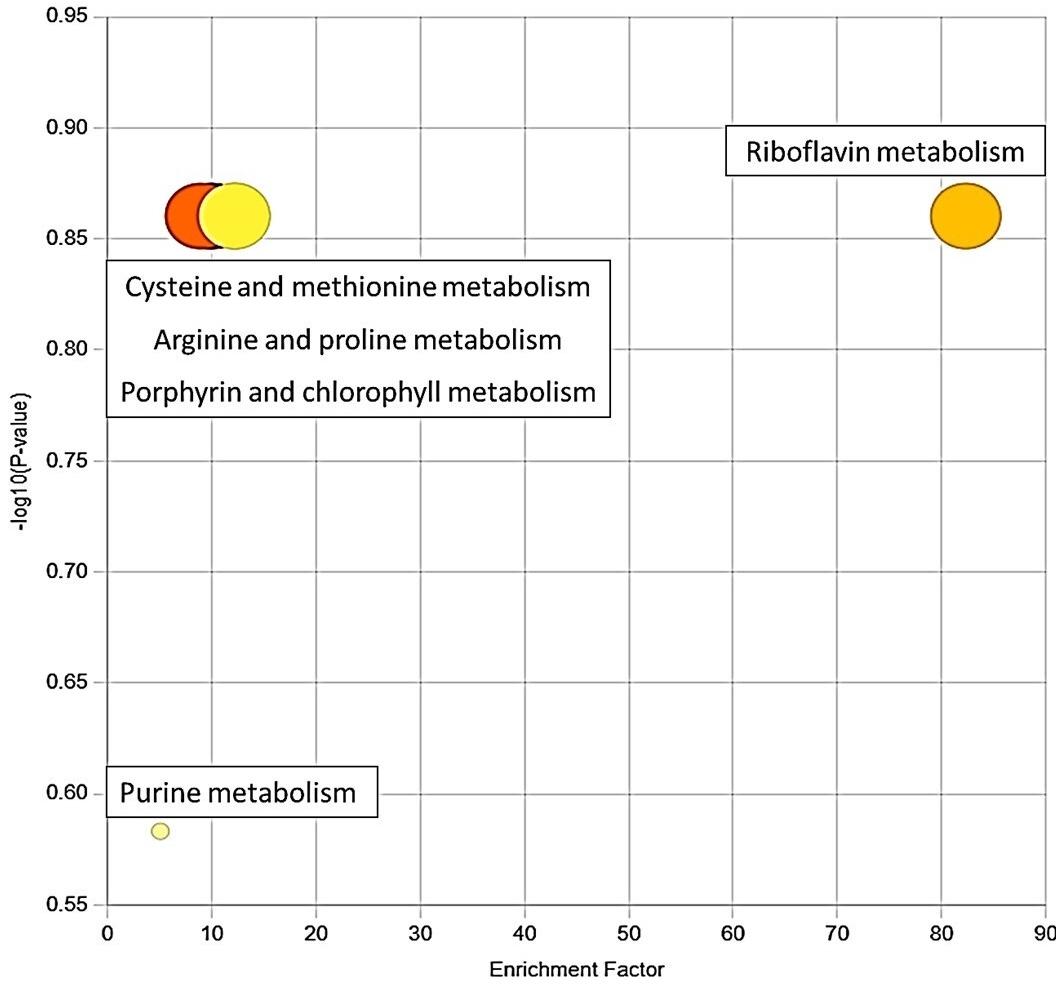
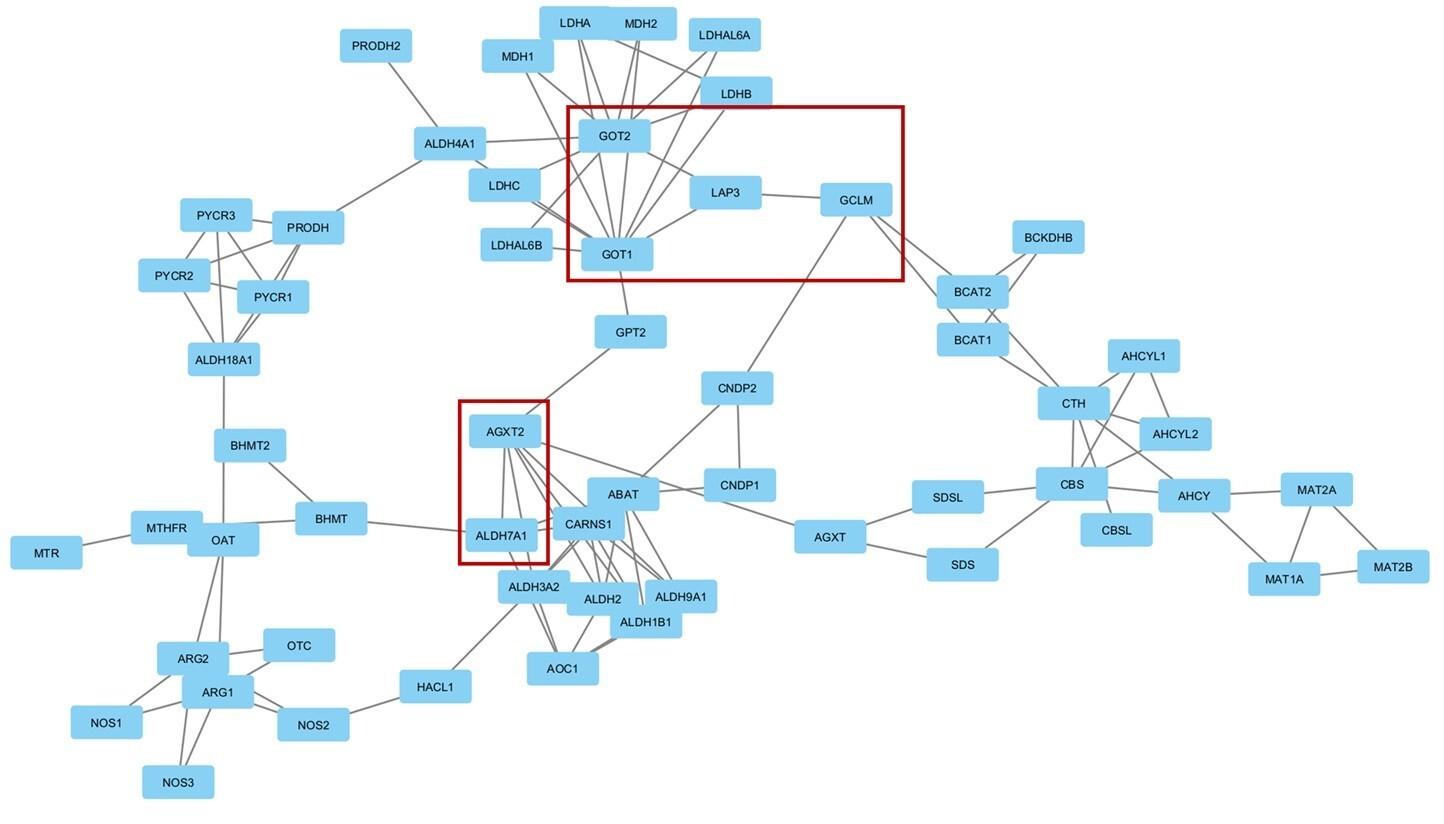
Table 1. Significantly altered metabolites in diabetic samples compared to non-diabetic samples.
Table 2. Enriched pathway with the corresponding compound hit.
Effects of Ramadan diurnal intermittent fasting on metabolism
We considered metabolites significantly altered if their levels changed by more than 1.5-fold and had a p-value < 0.05. In non-diabetic samples, Ramadan Diurnal Intermittent Fasting (RDIF) significantly elevated 41 features (m/z ratio) and lowered 44 features (Figure 4). Based on the m/z ratios, the KEGG IDs as well as these metabolites’ names were identified (Table 3).
Among the diabetic individuals, RDIF significantly elevated 98 metabolites and reduced 17 metabolites (Figure 5). Based on the m/z ratios, the KEGG IDs as well as the names of these metabolites were identified (Table 4).
The list of significantly elevated and reduced metabolites was ranked based on their p-values. Employing this list, three enriched pathways were identified using the functional analysis module of MetaboAnalyst (Figure 6). These pathways are significantly altered due to RDIF in diabetic individuals. The enrichment factor of the pathways in the figure is the ratio between the number of significant pathway hits from the uploaded m/z ratio list and the expected number of hits within that pathway. The information corresponding to enriched pathways is listed in Table 5.
An analysis of the gene networks produced from all three enriched pathways indicated a distinct relationship between the gene networks associated with the pentose phosphate pathway and the tyrosine metabolism pathway. Notably, these two pathways had a common set of three genes that formed an interaction set, as shown in Figure 7.
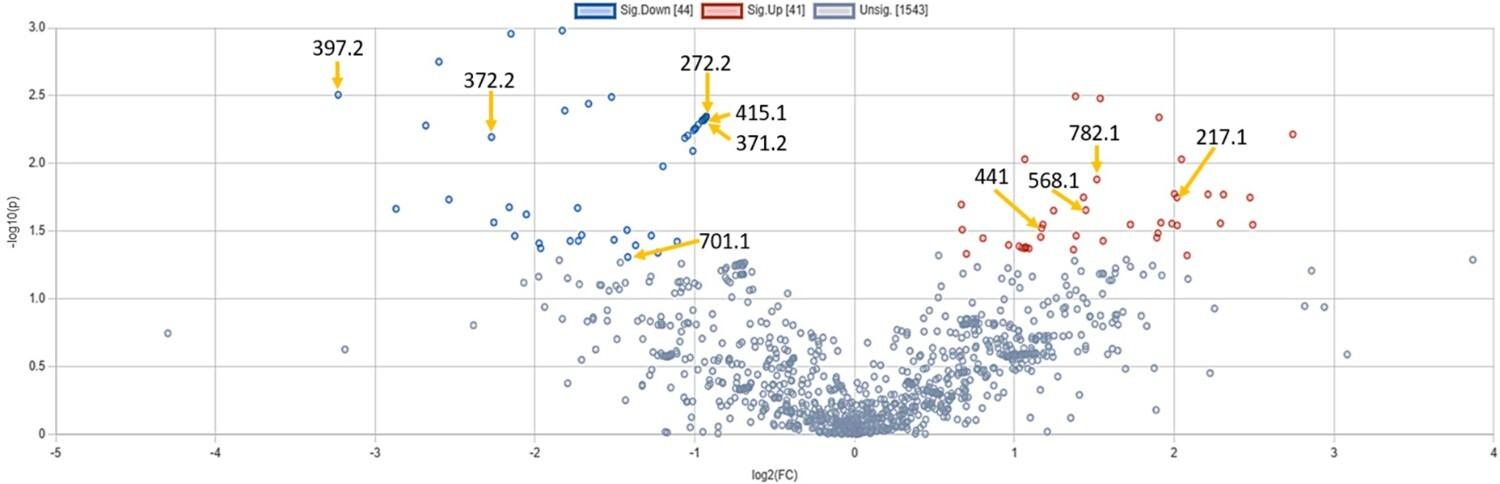
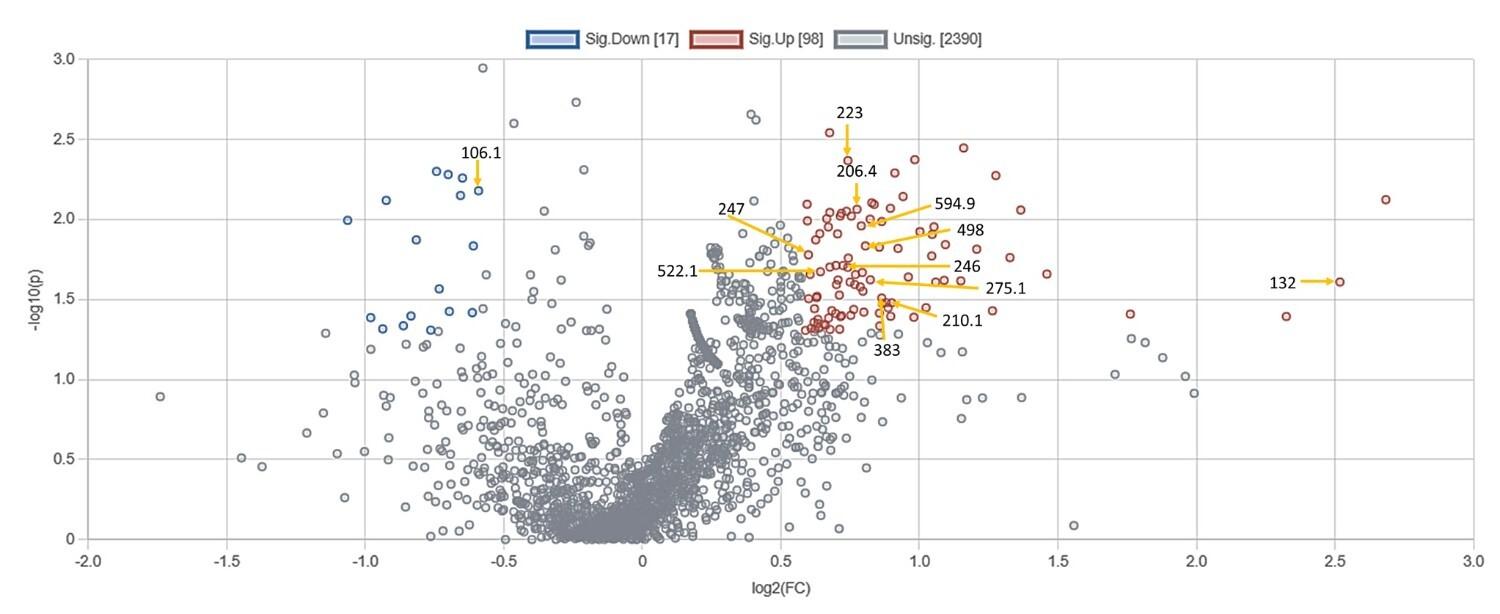
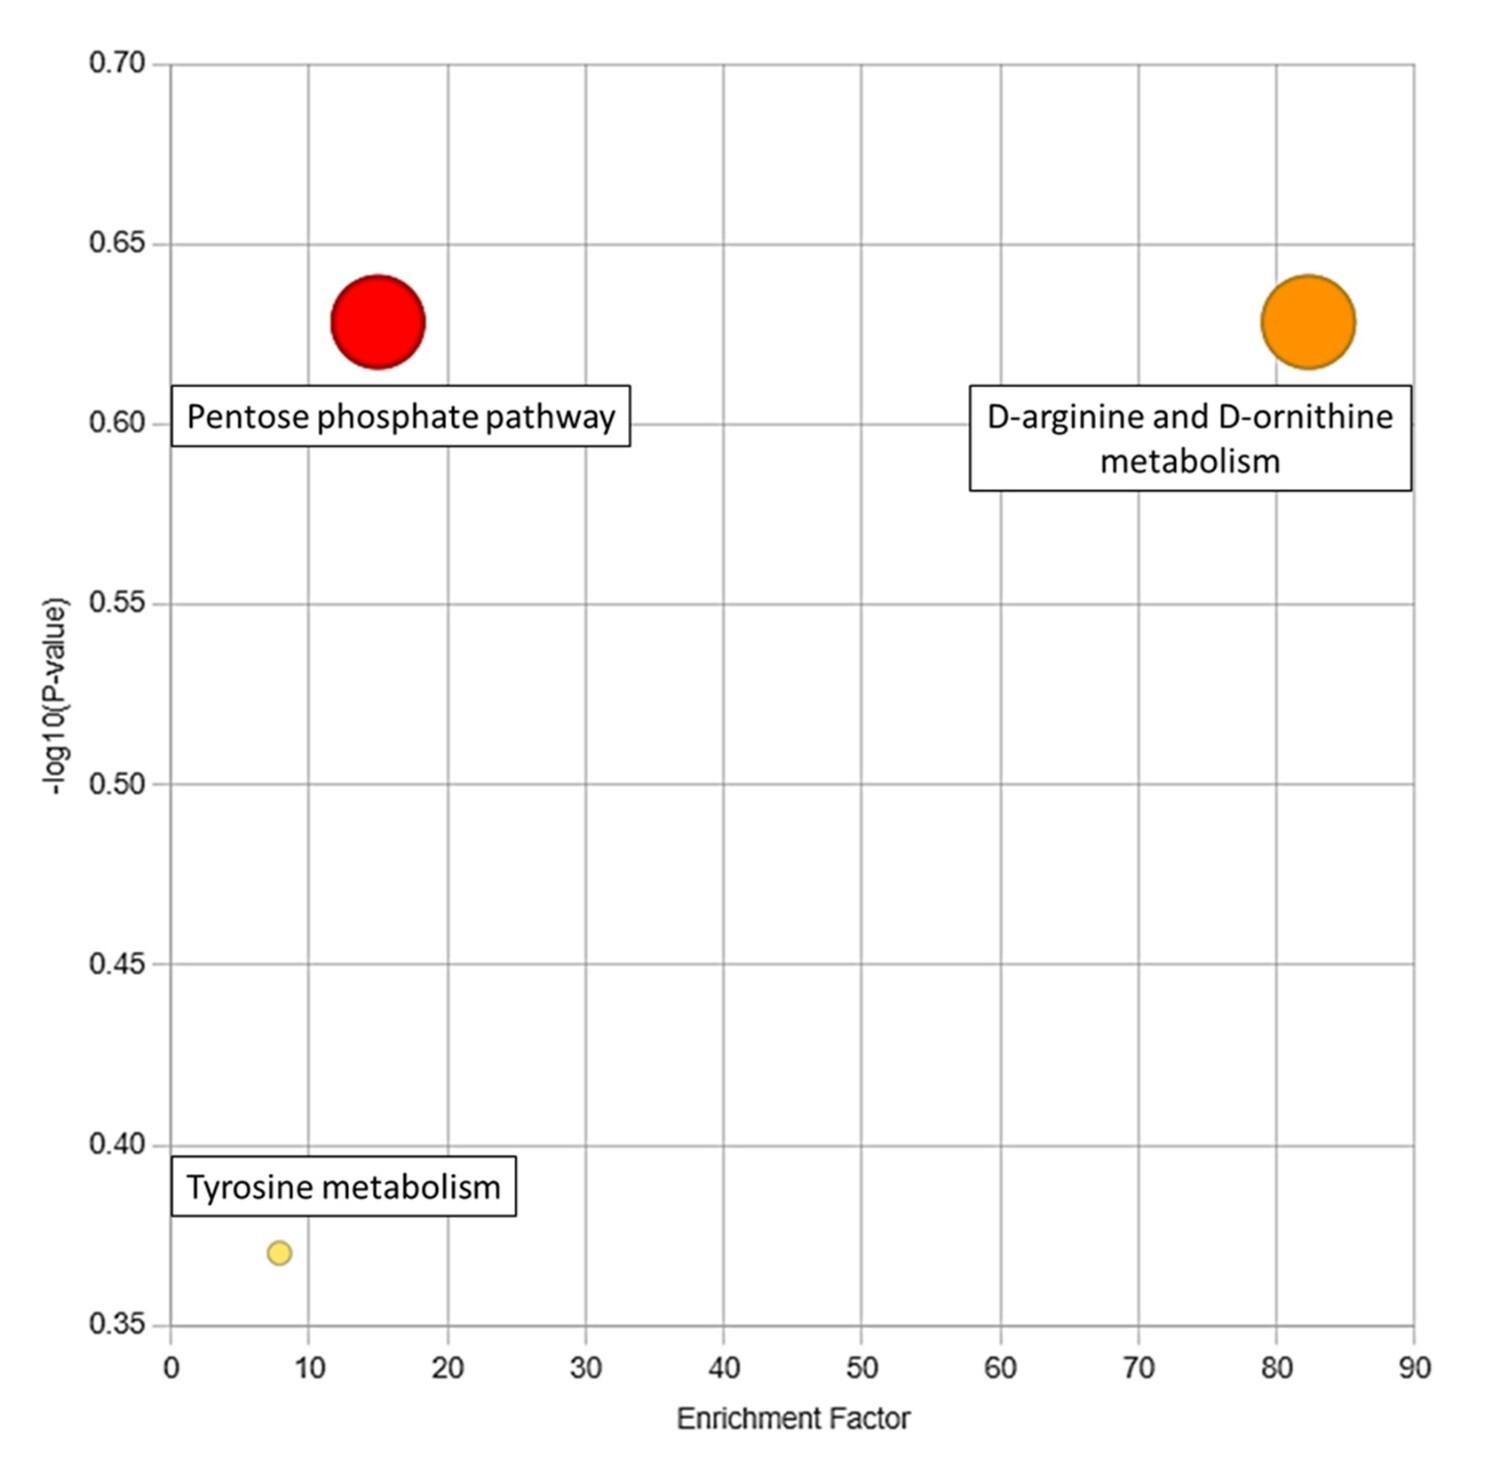
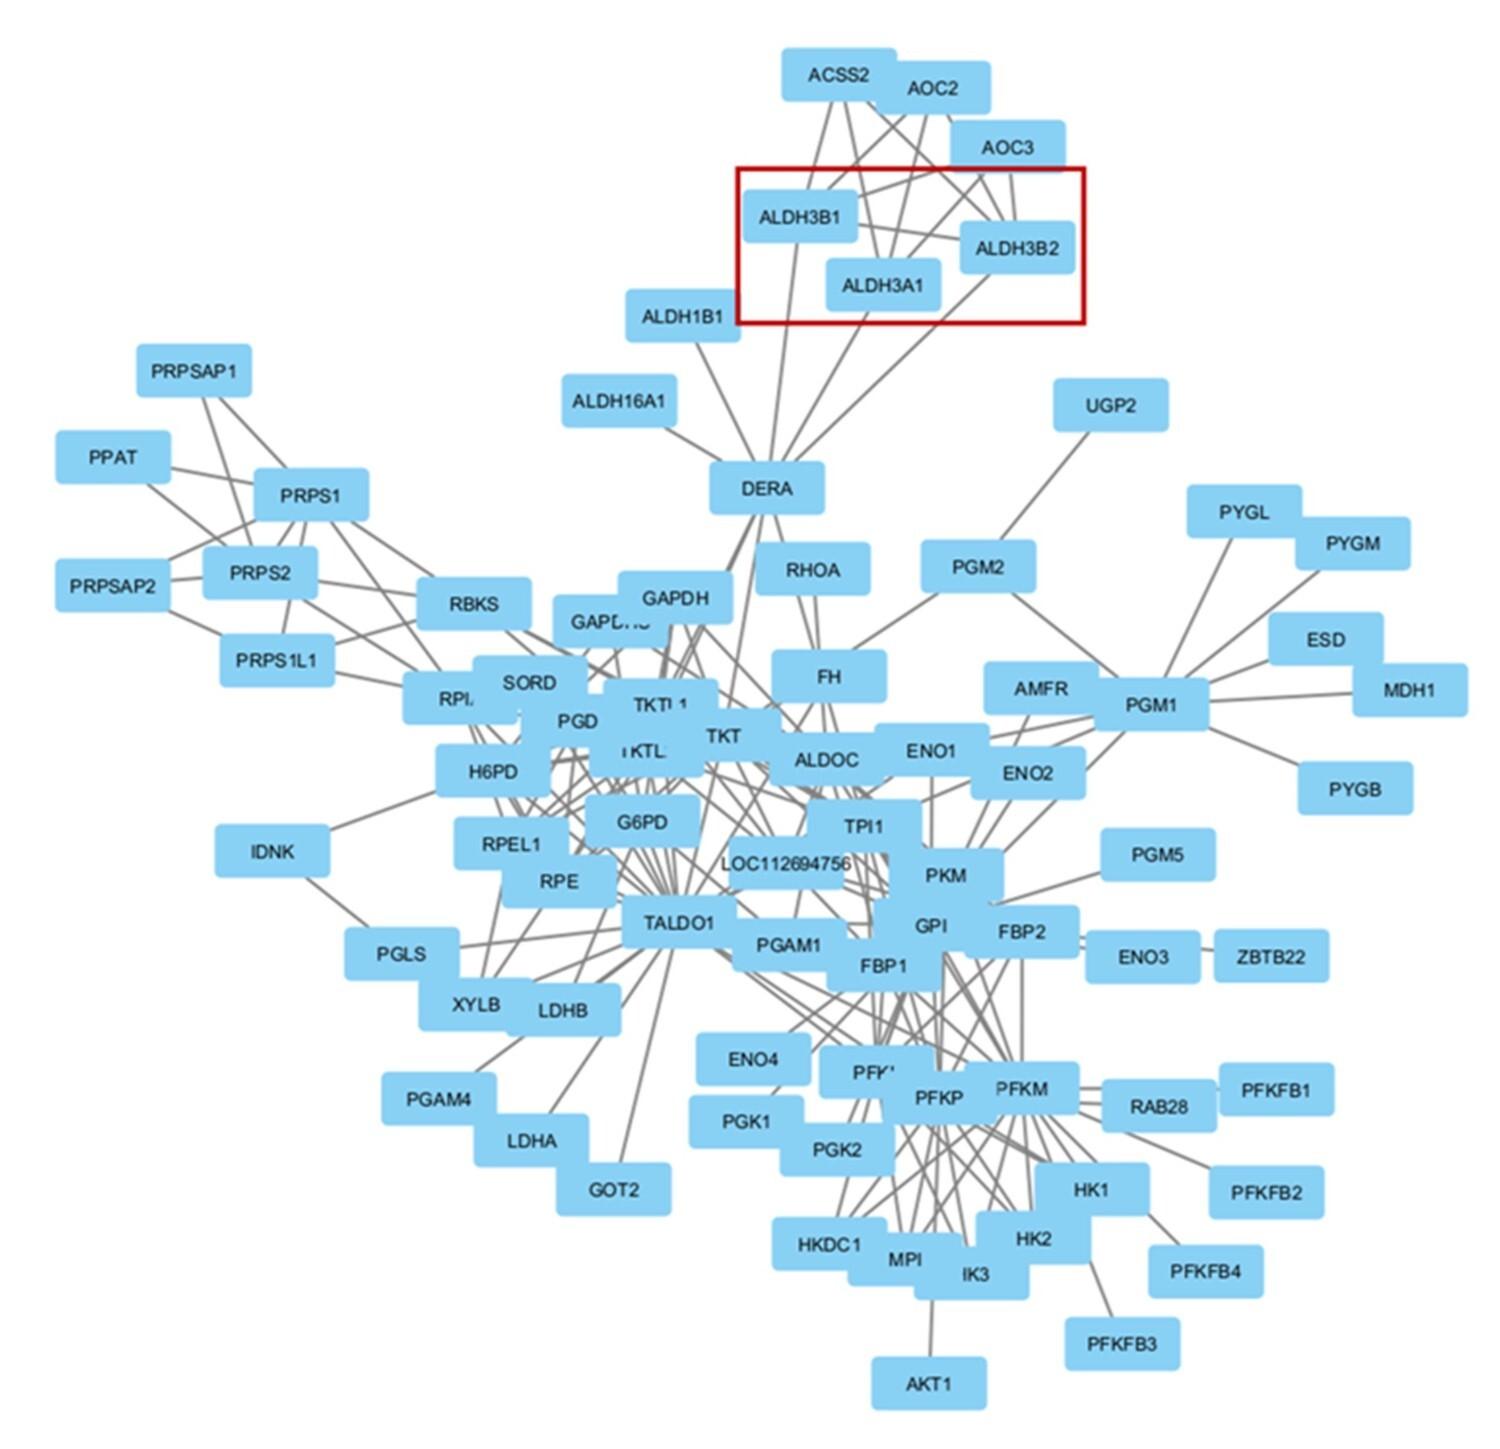
Table 3. Significantly altered metabolites in non-diabetic participants following RDIF.
Table 4. Significantly altered metabolites in diabetic participants following RDIF.
Table 5. Enriched pathways with corresponding compound hit following RDIF in diabetic individuals.
DISCUSSION
One of the objectives of our study was to explore the effect of diabetes on metabolic activity. There are conflicting reports on metabolites being potential metabolic biomarkers of diabetes. For example, higher levels of several amino acids (AAs) have been linked to insulin resistance and diabetes [18]. Conversely, conflicting evidence has surfaced from other studies indicating a reduction in the levels of many of these amino acids in individuals with diabetes [19]. Analysis of studies focusing on urine, serum, and/or plasma from diabetic subjects has identified lysine metabolite 2-aminoadipic acid, tyrosine, isoleucine, phenylalanine, tryptophan, valine, and leucine as correlated with T2DM [19]. However, following a meta-analysis, the amino acids significantly linked to T2DM were found to be phenylalanine, alanine, isoleucine, glutamate, tyrosine, and leucine [20]. Isoleucine, leucine, and valine—three branched-chain amino acids (BCAAs)—as well as the metabolites produced from these have shown strong correlations with T2DM early diagnosis and prediction [5]. Insulin resistance has been linked to elevated circulating levels of BCAAs, which may be the result of dysregulated BCAA breakdown [23]. Insulin resistance may promote protein degradation and hinder the oxidative metabolism of BCAAs in particular tissues, which may lead to elevated amino acid levels [24]. Increased levels of tyrosine, methionine, 2-hydroxybutyrate, 2-aminoadipate, methionine, lysine, histidine, alanine, phenylalanine, and glutamate have been associated with an elevated risk of T2DM [25-31], whereas the risk of T2DM development is inversely associated with glutamine and glycine level in serum [32]. Levels of some amino acids like glycine exhibit varying geographical associations, since a positive correlation was found in the Chinese population and an inverse association in Europeans [33, 34]. Serum concentrations of the nonessential amino acid alanine, which is synthesized from pyruvate and BCAAs, show a link to diabetes as well [35]. An interesting case appears in the cases of glutamate and glutamine. Glutamate is made from the citric acid cycle metabolite α-ketoglutaric acid and shows a positive correlation with diabetes. However, the levels of glutamate, a transamination product of glutamine, show an inverse association with diabetes [19, 35]. In the current study, S-adenosylmethioninamine, a metabolite of the cysteine and methionine metabolism pathway, as well as the arginine and proline metabolism pathway, was found to be more abundant in diabetic individuals than in non-diabetic individuals. Our data indicate that the cysteine and methionine metabolism pathways, as well as the arginine and proline metabolism pathways, have been upregulated in diabetic individuals.
In this study, the metabolite guanosine, the product of the purine metabolism pathway, showed a significant decrease, whereas 5-phosphoribosyl-1-amine, another metabolite within the purine metabolism pathway, showed a significant rise among individuals with diabetes compared to those without diabetes. Several earlier T2DM studies have reported elevated levels of various purine metabolism pathway metabolites. Serum uric acid, a common element of urine produced by the metabolic breakdown of purines, has been associated with insulin resistance and T2DM [36]. In a diabetic rat model, both plasma and liver tissues showed a substantial rise in purine metabolites such as hypoxanthine, xanthine, AMP, and inosine, which was accompanied by an increase in uric acid levels [37]. Three metabolites linked with purine metabolism were identified as particularly significant in relation to increased risk and incidence of T2DM. The metabolites are DMGU (N2, N2-dimethylguanosine), 7MG (7-methylguanine), and hypoxanthine [38].
Our study shows that adenosyl cobinamide, a metabolite within the porphyrin metabolism pathway, manifests decreased concentrations in individuals with diabetes as opposed to those without diabetes. Differences in porphyrin metabolism between T2DM patients and non-diabetic individuals were depicted in a previous report [39]. Metabolites associated with this pathway, namely L-urobilin, and L-urobilinogen, were found to be present at lower levels in the feces of individuals with T2DM [40].
In this study, diabetic individuals exhibited a reduction in riboflavin levels compared to their non-diabetic counterparts. The urinary excretion of riboflavin is markedly elevated in children afflicted with diabetes mellitus when juxtaposed with healthy adults, despite the serum riboflavin content remaining within normal parameters [41]. Therefore, it can be inferred that urinary excretion is a possible cause behind the phenomenon of reduced riboflavin levels in diabetic individuals.
To investigate further, we searched for the roles of the genes in the intersected pathways. GOT1 (glutamic-oxaloacetic transaminase 1), GOT2 (glutamic-oxaloacetic transaminase 2), LAP3 (leucine aminopeptidase 3), GCLM (glutamate-cysteine ligase modifier subunit), AGTX2 (alanine--glyoxylate aminotransferase 2), and ALDH7A1 (aldehyde dehydrogenase 7 family member A1) genes are shared between the arginine and proline metabolism pathway, and the cysteine and methionine metabolism pathway. GOT1 knockout in beta-cells leads to an increased rate of glycolysis, cell dysfunction, and impaired cellular identity, which may potentially result in diabetic conditions [42]. The expression of GOT2 is downregulated in hepatocellular carcinoma (HCC) tumor tissues, which in turn is correlated with advanced disease progression and unfavorable prognosis [43]. However, there is no identified correlation between GOT2 and diabetes. LAP3 is involved in non-alcoholic fatty liver disease formation and tumorigenesis through cholesterol-mediated upregulation of its expression and eventual autophagy inhibition [44]. Its association with diabetes has not been examined yet. The enzyme encoded by GCLM is associated with the regulation of oxidative stress. The rs41303970 variant of this gene was found to reduce the risk of developing T2DM [45]. In deleterious cases, plasma reactive oxygen species level is heightened and can potentially lead to diabetes [45]. rs37369, a variant in the AGXT2 gene, has been associated with an increased risk of diabetes [46]. ALDH7A1 gene variants were found to be associated with obesity in the West African population which can potentially lead to the development of diabetes [47].
Finally, we carried out an investigation on the effect of intermittent fasting on metabolic profile. In the past, there have been multiple independent studies that looked into the effect of intermittent fasting during Ramadan on obesity. However, there is no previous study on the impact of intermittent fasting on diabetic individuals and nondiabetic controls, and their metabolic alterations. Our study aimed to uncover the contribution of intermittent fasting on metabolic state. There are several metabolites that have been elevated and there are also other metabolites that have been reduced in non-diabetic individuals. However, using Mummichog algorithm, no enriched pathway was found for this group. On the contrary, the elevated and decreased metabolites of diabetic individuals due to intermittent fasting resulted in three enriched pathways. D-Glucono-1,5-lactone-6-phosphate, a metabolite of the pentose phosphate pathway (PPP), exhibited increased levels in diabetic patients following intermittent fasting. That is, RDIF resulted in the upregulation of the pentose phosphate pathway in diabetic individuals. In a different study, it was also found that metabolites of the pentose phosphate pathway exhibited an increase during a 58-hour fasting period [48]. T2DM is primarily characterized by impaired insulin secretion. The insulin stored in granules within pancreatic islet β cells is released through exocytosis facilitated by sentrin-specific protease 1 (SENP1) [49]. The pentose phosphate pathway (PPP), a significant supplier of NADPH, plays a crucial role in regulating glucose-stimulated insulin secretion (GSIS) [50]. NADPH converts oxidized glutathione (GSSG) to reduced glutathione (GSH), which promotes insulin granule exocytosis through SENP1 [51]. This implies that the upregulation of PPP, induced by intermittent fasting in diabetic individuals may potentially benefit them by enhancing insulin secretion.
In the present investigation, 3,4-Dihydroxymandelate or Gentisate aldehyde, a metabolite within the tyrosine metabolism pathway, displayed an elevated presence in diabetic individuals following intermittent fasting. The upregulation of the tyrosine metabolism pathway can potentially lead to the reduction in tyrosine levels in diabetic patients due to intermittent fasting. Tyrosine, alongside other aromatic chain amino acids, demonstrated decreased levels following the RDIF intervention in obese subjects [52]. Given that tyrosine metabolites have been observed to be elevated in incident diabetes among South Asian individuals, the reduction in tyrosine levels post-RDIF underscores the potential diabetes-preventative attributes of intermittent fasting [52, 53].
As a result of intermittent fasting, 5-Guanidino-2-oxopentanoate, a metabolite within the D-arginine and D-ornithine metabolism pathway, was found to be reduced in diabetic patients in the present investigation. However, no previous study has explored the impact of this metabolic pathway on diabetes.
Among the 3 enriched pathways, the pentose phosphate pathway and tyrosine metabolism pathway share a common set of interactions comprising three genes: ALDH3A1 (aldehyde dehydrogenase 3 family member A1), ALDH3B1 (aldehyde dehydrogenase 3 family member B1), and ALDH3B2 (aldehyde dehydrogenase 3 family member B2). We hypothesize that the upregulation of the pathways may have resulted from overexpression of these common genes. ALDH3A1 knockout mutant Zebrafish showed impaired glucose homeostasis and hyperglycemia [54]. Therefore, overexpression of ALDH3A1 due to intermittent fasting may help diabetic individuals with glycemic control. ALDH3B1 mitigates the cellular oxidative stress implicated in diabetic nephropathy [55]. Overexpression after intermittent fasting may reduce the complications of diabetic nephropathy through oxidative stress reduction. The polymorphic forms of ALDH3B2 are associated with carcinoma such as colorectal cancer and esophageal squamous cell carcinoma [56], but its association with diabetes has not yet been found.
CONCLUSIONS
This study explored the changes in metabolism among diabetic patients and how intermittent fasting alters the metabolism of diabetic and non-diabetic individuals. Five metabolic pathways were found to be significantly affected in diabetic patients compared to non-diabetic individuals. We found prominent alterations in three metabolic pathways in the diabetic patient group undergoing intermittent fasting. We observed no such alteration of the metabolic pathway in non-diabetic individuals undergoing intermittent fasting. These pathways have clinical significance. However, the major setback of this study was the limited sample size. Despite this, our study provides insight into the beneficial effects of diurnal fasting for controlling diabetes and opens avenues for further research.
ACKNOWLEDGEMENTS
None.
AUTHOR CONTRIBUTIONS
Design of the work: SDN, AAS; Acquisition, analysis, and interpretation of data: TA, SDN, MHA, SST; Manuscript preparation and reviewing: AB, TA, SA, AAS. All authors have approved the final version of the manuscript.
CONFLICTS OF INTEREST
There is no conflict of interest among the authors.
References
- [1]Lanza IR, Zhang S, et al. Quantitative metabolomics by h-nmr and lc-ms/ms confirms altered metabolic pathways in diabetes. PloS one. 2010;5:e10538.
- [2]Roden M, Shulman GIJN. The integrative biology of type 2 diabetes. 2019;576:51-60.
- [3]Nowlin SY, Hammer MJ, et al. Diet, inflammation, and glycemic control in type 2 diabetes: An integrative review of the literature. Journal of nutrition and metabolism. 2012;2012:542698.
- [4]Ma RC, Lin X, et al. Causes of type 2 diabetes in china. The lancet Diabetes & endocrinology. 2014;2:980-91.
- [5]Shahisavandi M, Wang K, et al. Exploring metabolomic patterns in type 2 diabetes mellitus and response to glucose-lowering medications—review. 2023;14:1464.
- [6]Atlas I. About diabetes - facts & figures. International Diabetes Federation; 2021.
- [7]Abdelrahim D, Faris ME, et al. Impact of ramadan diurnal intermittent fasting on hypoglycemic events in patients with type 2 diabetes: A systematic review of randomized controlled trials and observational studies. 2021;12:624423.
- [8]Jahrami HA, Alsibai J, et al. Impact of ramadan diurnal intermittent fasting on the metabolic syndrome components in healthy, non-athletic muslim people aged over 15 years: A systematic review and meta-analysis. 2020;123:1-22.
- [9]Mo'ez Al-Islam EF, Jahrami HA, et al. Impact of diurnal intermittent fasting during ramadan on inflammatory and oxidative stress markers in healthy people: Systematic review and meta-analysis. 2019;15:18-26.
- [10]Faris MeA-IE, Hussein RN, et al. Impact of ramadan intermittent fasting on oxidative stress measured by urinary 15--isoprostane. 2012;2012.
- [11]Faris MeA-I, Jahrami H, et al. A systematic review, meta-analysis, and meta-regression of the impact of diurnal intermittent fasting during ramadan on glucometabolic markers in healthy subjects. Diabetes Research and Clinical Practice. 2020;165:108226.
- [12]Jahrami HA, Faris ME, et al. Does four-week consecutive, dawn-to-sunset intermittent fasting during ramadan affect cardiometabolic risk factors in healthy adults? A systematic review, meta-analysis, and meta-regression. 2021;31:2273-301.
- [13]Hannan MA, Rahman MA, et al. Intermittent fasting, a possible priming tool for host defense against sars-cov-2 infection: Crosstalk among calorie restriction, autophagy and immune response. Immunol Lett. 2020;226:38-45.
- [14]Mindikoglu AL, Abdulsada MM, et al. Intermittent fasting from dawn to sunset for 30 consecutive days is associated with anticancer proteomic signature and upregulates key regulatory proteins of glucose and lipid metabolism, circadian clock, DNA repair, cytoskeleton remodeling, immune system and cognitive function in healthy subjects. Journal of proteomics. 2020;217:103645.
- [15]Chiu TT, Patel N, et al. Arp2/3- and cofilin-coordinated actin dynamics is required for insulin-mediated glut4 translocation to the surface of muscle cells. Molecular biology of the cell. 2010;21:3529-39.
- [16]Pauling L, Robinson AB, et al. Quantitative analysis of urine vapor and breath by gas-liquid partition chromatography. 1971;68:2374-6.
- [17]Jin Q, Ma RCW. Metabolomics in diabetes and diabetic complications: Insights from epidemiological studies. Cells. 2021;10.
- [18]Luetscher JAJTJoCI. The metabolism of amino acids in diabetes mellitus. 1942;21:275-9.
- [19]Palmer ND, Stevens RD, et al. Metabolomic profile associated with insulin resistance and conversion to diabetes in the insulin resistance atherosclerosis study. 2015;100:E463-E8.
- [20]Xia J, Psychogios N, et al. Metaboanalyst: A web server for metabolomic data analysis and interpretation. Nucleic acids research. 2009;37:W652-60.
- [21]Zhou G, Soufan O, et al. Networkanalyst 3.0: A visual analytics platform for comprehensive gene expression profiling and meta-analysis. Nucleic acids research. 2019;47:W234-W41.
- [22]Shannon P, Markiel A, et al. Cytoscape: A software environment for integrated models of biomolecular interaction networks. Genome research. 2003;13:2498-504.
- [23]Gannon NP, Schnuck JK, et al. Bcaa metabolism and insulin sensitivity - dysregulated by metabolic status? Molecular nutrition & food research. 2018;62:e1700756.
- [24]Newgard CB, An J, et al. A branched-chain amino acid-related metabolic signature that differentiates obese and lean humans and contributes to insulin resistance. Cell metabolism. 2009;9:311-26.
- [25]Merino J, Leong A, et al. Metabolomics insights into early type 2 diabetes pathogenesis and detection in individuals with normal fasting glucose. 2018;61:1315-24.
- [26]Tai E, Tan M, et al. Insulin resistance is associated with a metabolic profile of altered protein metabolism in chinese and asian-indian men. 2010;53:757-67.
- [27]Alqudah A, Wedyan M, et al. Plasma amino acids metabolomics' important in glucose management in type 2 diabetes. 2021;12:695418.
- [28]Zhang X, Wang Y, et al. Human serum metabonomic analysis reveals progression axes for glucose intolerance and insulin resistance statuses. 2009;8:5188-95.
- [29]Würtz P, Tiainen M, et al. Circulating metabolite predictors of glycemia in middle-aged men and women. 2012;35:1749-56.
- [30]Geidenstam N, Spégel P, et al. Metabolite profile deviations in an oral glucose tolerance test—a comparison between lean and obese individuals. 2014;22:2388-95.
- [31]Sîrbu A, Andrienko G, et al. Human migration: The big data perspective. International Journal of Data Science and Analytics. 2020;11:341-60.
- [32]Mitro SD, Liu J, et al. Per-and polyfluoroalkyl substance plasma concentrations and metabolomic markers of type 2 diabetes in the diabetes prevention program trial. 2021;232:113680.
- [33]Floegel A, Stefan N, et al. Identification of serum metabolites associated with risk of type 2 diabetes using a targeted metabolomic approach. 2013;62:639-48.
- [34]Lu Y, Wang Y, et al. Metabolic signatures and risk of type 2 diabetes in a chinese population: An untargeted metabolomics study using both lc-ms and gc-ms. 2016;59:2349-59.
- [35]Stančáková A, Civelek M, et al. Hyperglycemia and a common variant of gckr are associated with the levels of eight amino acids in 9,369 finnish men. 2012;61:1895-902.
- [36]Modan M, Halkin H, et al. Elevated serum uric acid--a facet of hyperinsulinaemia. Diabetologia. 1987;30:713-8.
- [37]Varadaiah YGC, Sivanesan S, et al. Purine metabolites can indicate diabetes progression. Archives of physiology and biochemistry. 2022;128:87-91.
- [38]Ottosson F, Smith E, et al. Purine metabolites and carnitine biosynthesis intermediates are biomarkers for incident type 2 diabetes. The Journal of clinical endocrinology and metabolism. 2019;104:4921-30.
- [39]Teh LK, Rofiee M, et al. Metabolite biomarkers and predictive model analysis for patients with type 2 diabetes mellitus with and without complications. Endocrinology Research and Practice. 2023;27:135-47.
- [40]Zhou Y, Men L, et al. Fecal metabolomics of type 2 diabetic rats and treatment with gardenia jasminoides ellis based on mass spectrometry technique. Journal of agricultural and food chemistry. 2018;66:1591-9.
- [41]Kodentsova VM, Alekseeva IA, et al. [riboflavin metabolism in diabetes mellitus]. Ukrainskii biokhimicheskii zhurnal (1978). 1992;64:105-8.
- [42]Murao N, Yokoi N, et al. Increased glycolysis affects β-cell function and identity in aging and diabetes. Molecular metabolism. 2022;55:101414.
- [43]Li Y, Li B, et al. Got2 silencing promotes reprogramming of glutamine metabolism and sensitizes hepatocellular carcinoma to glutaminase inhibitors. Cancer research. 2022;82:3223-35.
- [44]Feng L, Chen Y, et al. Cholesterol-induced leucine aminopeptidase 3 (lap3) upregulation inhibits cell autophagy in pathogenesis of nafld. Aging. 2022;14:3259-75.
- [45]Azarova I, Klyosova E, et al. Genetic variants in glutamate cysteine ligase confer protection against type 2 diabetes. Molecular biology reports. 2020;47:5793-805.
- [46]Kumon H, Miyake Y, et al. Functional agxt2 snp rs37369 variant is a risk factor for diabetes mellitus: Baseline data from the aidai cohort study in japan. Canadian journal of diabetes. 2022;46:829-34.
- [47]Zhou JB, Yang JK, et al. Variants in kcnq1, ap3s1, man2a1, and aldh7a1 and the risk of type 2 diabetes in the chinese northern han population: A case-control study and meta-analysis. Medical science monitor : international medical journal of experimental and clinical research. 2010;16:Br179-83.
- [48]Kondoh H, Teruya T, et al. Metabolomics of human fasting: New insights about old questions. 2020;10:200176.
- [49]Kalwat MA, Cobb MHJP, et al. Mechanisms of the amplifying pathway of insulin secretion in the β cell. 2017;179:17-30.
- [50]Ge T, Yang J, et al. The role of the pentose phosphate pathway in diabetes and cancer. Frontiers in endocrinology. 2020;11:365.
- [51]Ferdaoussi M, Dai X, et al. Isocitrate-to-senp1 signaling amplifies insulin secretion and rescues dysfunctional β cells. 2015;125:3847-60.
- [52]Madkour M, Giddey AD, et al. Ramadan diurnal intermittent fasting is associated with significant plasma metabolomics changes in subjects with overweight and obesity: A prospective cohort study. Frontiers in nutrition. 2022;9:1008730.
- [53]Tillin T, Hughes AD, et al. Diabetes risk and amino acid profiles: Cross-sectional and prospective analyses of ethnicity, amino acids and diabetes in a south asian and european cohort from the sabre (southall and brent revisited) study. 2015;58:968-79.
- [54]Lou B, Boger M, et al. Elevated 4-hydroxynonenal induces hyperglycaemia via aldh3a1 loss in zebrafish and associates with diabetes progression in humans. Redox Biology. 2020;37:101723.
- [55]Marchitti SA, Orlicky DJ, et al. Aldehyde dehydrogenase 3b1 (aldh3b1): Immunohistochemical tissue distribution and cellular-specific localization in normal and cancerous human tissues. The journal of histochemistry and cytochemistry : official journal of the Histochemistry Society. 2010;58:765-83.
- [56]Xia J, Li S, et al. Aldehyde dehydrogenase in solid tumors and other diseases: Potential biomarkers and therapeutic targets. 2023;4:e195.